GIS and Arcmap
Layout View in ArcMap
All output is created purposely for inclusion in a report, a thesis, a website or maybe as an image in a presentation. In all these cases, the given space is limited. Before creating the layout (the map), it is important to define the exact dimensions of the output. All the visualized elements in the map (lines, text, areas, points, colours, patterns, ...) have to be such that in the final presentation these are readable. Rule of thumb mostly is: "If an element cannot be distinguished (one cannot read it), you do not have to place it in the map."
Page and print setup
If for example a map is created on A3 size (width 29,7cm, height 420cm), but it will be included in a thesis with 10 centimetres width, all content is reduced to about 30% of its original size. If the text size is 9 points, it will be reduced to 3 points; a point symbol of 3mm will be reduced to 1 mm; etc. Content nicely distributed when on A3 size will appear very crowded when reduced 30%. Always design for the final output (for the final scale) and these problems will not occur.
For more information, visit the Arcmap Help pages.
From the main menu select [File / Page and Print Setup…], the “Page and Print Setup” window opens.
The “Printer Setup” serves the local identification of the printer where the map will be printed to when printing directly from ArcMap. However, in most cases a file is created as final output for distribution.
The “Map Page Size” enables to set a required size which may be different than the printer paper size. When unchecking “Use Printer Page Settings”, own required size and orientation.
Switch to the “Layout” view, both maps are positioned in the center of the selected final output size.
Layout view
After adding all necessary data frames and have all content and visualization correctly done, the final output can be created in the layout view. When opening the layout view, all data frames are positioned on top. The following video demontrates what needs to be done to convert this into an attractive map.
When switching from “Data view” to “Layout view” both “Data frames” are visible on the layout area. When re-positioning the two “Data frames” on the layout area, it shows that the one activated here is also activated in the “Table Of Contents”.
Changes made in the “Table Of Contents” “Data frame”, either or not active, will give a direct change in the map on the “Layout view”
Positioning the maps
If your output is, for example, an illustration in a thesis you always have to know the actual space you have available for all elements to be used in that illustration. The space available is not the same as the size of the paper, there are always margins around the content and you need to know the size of these. Before start working on the layout view, first sketch the illustration, know which elements you need and figure out how to distribute them on the available space. This activity should have been done before you even start visualizing the data because content density, map scale and symbol sizes all relate to the available space and the area to be shown on the map.
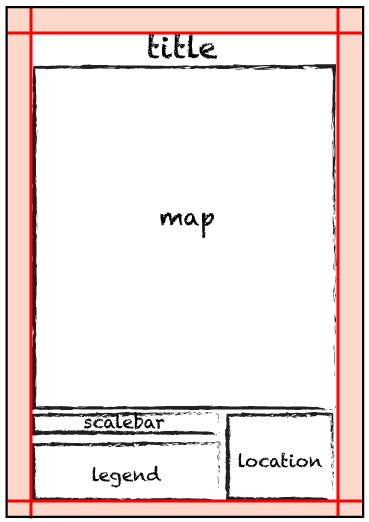
In the layout view, it is advised to first add guidelines, indicating the edges on where to place the content (based on the known sizes of the margin). In this demo the margins are given as 1.5 cm left and right and 1 cm top and bottom. After that, set the size of the maps and give them the appropriate scale so that they fill the area neatly. Other design details can be implemented later: add frame lines, give background colours, etc.
Best is to work with guidelines, they are a great help in positioning but will not show in the final output. A guide can be placed, by click-and-hold the mouse in the “Ruler” area left and top in the “Layout view”. Changing the mouse-position in the ruler area shows in the left-top of the layout window a “position” of the guide in the unit chosen in the “Page and Print Setup”. According to a sketch or design, position these guides on the page, before starting to position the maps.
The guides are “magnetic” which is a great help in aligning the maps and elements in the layout. After positioning the maps, the correct scale has to be given for each, such that they fill the space in the required way. Important to know, changes for scale have effect on the active “Data frame”. Changing the scale of a map in the “Data view” will also change the scale in the “Layout view”.
Add map elements
The map is not complete without some essential elements to help the reader to understand where the map is about and where it is located. The map title, the legend and a map scale are three basic elements that always need to be included in the final layout. The need for a North arrow depends on the orientation of the map. If the map is North oriented, there is no need to include it. Graticules and grids depend on scale and theme of the map, always ask yourself if these elements are required to understand the map.
A title is the most generalized description of the map, it has to give a good and concise description. The map elements can be placed using the [Insert] menu, used before to add another Data frame to the map.
Select the [Insert / Title] option from the main menu, the “Insert Title” window opens. Insert the title for the map, in this example it is “Schools in Enschede, 2019”, [OK] when ready. Some positioning and styling have to be done: the textbox is of course not in the required position on the map, the text may not have the correct font, font size and colour.
Select the [Insert / Scale bar…] option from the main menu, the “Scale Bar Selector” window opens. There is a choice of many different scale bar styles, for this demo the “Alternating Scale Bar 1” is selected. Select the [Properties], the “Scale Bar” window opens where “Scale and Units”, “Numbers and Marks” and “Format” of the scale bar can be set. After accepting the settings, position the scale bar in the required location, change the length of the scale bar such that the numbers are showing full or half kilometers. A general advice: do not make the scale bar and used text too large, it is meant as supportive information and not as main information.
Select the [Insert / Legend…] option from the main menu, the “Legend Wizard” window opens. Select the map layers to be included in the legend items, the visible layers in the “Table Of Contents” are added by default, it may however be that another layer has to be included or excluded. The positioning of the legend items can be controlled by using the arrows on the right-hand side in the “Legend Wizard”. The number of columns depends on the length of the legend and the available space in the layout, [Next] to accept the settings.
A title for a legend is superfluous, it is not required, but also not wrong to place on the other hand. [Next] to continue.
Frames for map elements add additional, non-essential, details to the final result. When having a white background for the map, also a background is not needed. Otherwise best option is to select the same background as is used in the layout. [Next] to continue.
Same advice as given for the scale bar can be given for the legend, do not make it too large, it is supportive information, a key for the user to read the map, the map is most important. Take care, dimensions here are given in pts, any idea how much one point is in millimeters? Select the styles for the linear features and area features for display in the legend. [Next] to continue.
Spacing is an important design element for the legend, do not use too much space, let space help to group elements. [Finish} to continue.
The legend is placed in the layout, it requires proper positioning. When double-click on the legend, the “Legend Properties” window opens, which gives access to all the options needed to shape the legend according the design requirements, legend, data and given styles are linked.
For the ultimate final legend design, it is an option to unlink the legend from data and styles. Right-mouse-click on the legend to get access to the contextual menu and select the option “Convert To Graphics”, the legend is now a group of graphic objects. A double-click on the legend will now show the “Properties” of the group.
Right-mouse-click on the legend and select the option “Ungroup”, this makes that smaller groups are released. These can be edited and positioned to get a better legend. Important, and unfortunately forgotten to correct in this demo, do not use “_” in legend names, see “Main_roads”.
Map Output
In ArcMap the map can be directly printed from the [File/Print...] menu. Depending on the view you are currently in, the "data view" window or the "layout view" window will be printed. However, if you have to deliver a file (to be included in a report or delivered as a separate map to be printed) the [File/Export Map...] menu is used. In this case also, the view that is active is the one that will be exported. Before printing or exporting to a file, be sure about the requirements for further use of the output..
Opening [File / Export Map…] option opens the “Export Map” window, which enables output to a file in different formats and quality. First locate the directory where the output file has to be saved to, this avoids long search to the file after saving. Next select the file format, ArcMap support most common vector and bitmap formats. The first five (emf, eps, ai, pdf and svg) support vector output and can also contain bitmaps, the last five (bmp, jpeg, png, tiff and gif) are only bitmaps. The choice of format largely depends on the use of the file.
For inclusion in a web page and in a thesis, JPEG is most commonly used. Resolution setting depends on the use also, for inclusion in a thesis, better choose a higher resolution, but at least 250 dpi if it is printed on a standard laser- or inkjet printer, better inquire how the file is used, where it is printed. Use maximum quality, so do not compress the file. After all settings are done, hit [Save] to create the file.
A map that will be finally printed as a single product, a PDF is the better choice. All vectors (including text) will be saved as is (it will not be rasterized). Also, here use a high resolution, it will influence the accuracy and quality of the vectors and text. In the [Format] tab, check all the boxes to make sure that the PDF file contains all information and thus can be printed correctly. The other settings in the other tabs can stay at default. Be sure the output location is correct, and the file is named properly.
Output to a printing-device, using [File / Print…] option can be done either from the “Data view” or the “Layout view”, and it will generate the output accordingly.
This brings the introduction to GisApplications-ArcMap to an end.