Foreword
This information has been put together for those who participate in the common course "GIS and RS for Geospatial Problem Solving".
In this course, you will make use of a GIS application to manage, process and disseminate your geo-data. Some of you may have never used such an application before, therefore this basic introduction has been developed. This tutorial focuses on ArcMAP, proprietary software from the company Esri.
The second part of this demo, introduces the Open Source software QGIS. After exploring both applications, you can decide which one suits you best.
The approach
This demo is not following a cookbook approach, the aim is not to show you where to find all the buttons and tools. The intention is rather to point you in the correct direction, letting you experiment with sample data to understand what a GIS application is about.
An introduction to the work environment (where to find what and what is the use of it) helps you to understand the tutorial. A simple data-set is prepared and will be used to guide you through the basic operations. The tutorial follows roughly the standard production process used in a GIS production task. Figure 1 below shows you the main steps, these will be further introduced in a later stage.
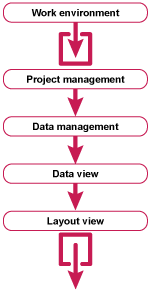
In the Work environment, an overview is given of the location of different windows and menus. You will get a brief introduction to their use.
Project management is about the work you have to do to get to the final intended product (this can amongst others be an analysis or a map output). Questions to be answered are: where is the geographic location; how large is the area covered in this project; what data do I need to get the required result; what will be the output? Not knowing the end (what has te be delivered) makes that you cannot start working.
Data management is more than just knowing where and how data is stored, it is also about correct content, age of the collected data, location of the area covered, the quality, its origin ...
The data editing, analysis and visualization will be much easier done when being able to actually see the data, the actual location of some features with respect to others. When data is loaded in a GIS application, data will be listed in layers, but will be also shown in a window, the Data-view in ArcMap or the Map area in QGIS This is the environment of the GIS-application where data can be edited, analyzed, processed, visualized ...
In a GIS application, the final output of a project can be the result of spatial data analysis. Most times these results need to be shared with others for further discussion, published in a report, included in a web page or distributed as a map. Sometimes a simple "screen capture" satisfies, but in most cases, elements as title, grid or graticule, scale and authors information have to be added. This tasks are done in the Layout-view in ArcMap or Layout window in QGIS.The final map can be exported to various output formats.
Get started...
In the coming pages of this online guide, you will be introduced to work with a GIS application, starting with the project preparation, ending with a final output and exploring the in-between steps of data management and data manipulation/processing.