Introduction
In this exercise you will discover the basics of using the JavaScript D3 library to build dynamic web pages. You will learn:
- the principles of using the D3 library
- D3 selections for DOM access
- D3 data binding to change the DOM based on data
- loading external data
- using D3 scales and axes
- using D3 for maps
The javascript library D3.js was created to fill a need for web-accessible,
sophisticated
data visualisation. Its creator is Mike Bostock, who started it as a research project for his PhD
work and later continued working on it in his job as Graphics Editor for the New York Times. He now
is full-time developer.
Until recently, you couldn't build high-performance, rich internet applications in the browser unless you built them in Flash or as a Java applet. Flash and Java are still around on the internet, and especially for internal web apps, for this reason. D3.js provides the same performance, but integrated into web standards and the Document Object Model (DOM) at the core of HTML. D3 provides developers with the ability to create rich interactive and animated content based on data and tie that content to existing web page elements. It gives you the tools to create high-performance data dashboards and sophisticated data visualization, and to dynamically update traditional web content.
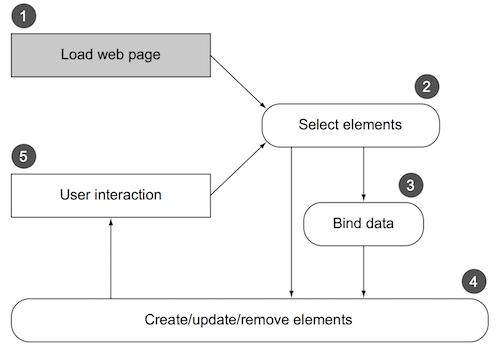
In figure 1, you see the common use of D3: A page is typically built in such a way that the page loads with styles, data, and content as defined in traditional HTML development [1] with its initial display using D3 selections of HTML elements [2], either with data-binding [3] or without it. The selections and data-binding can be used to modify the structure and appearance of the page [4]. The changes in structure prompt user interaction [5], which causes new selections with and without data- binding to further alter the page. Step 1 is shown differently because it only happens only once (when you load the page), whereas every other step may happen multiple times, depending on user interaction.
Learning D3 is not all that easy, because it is not a high-level charting or mapping library, instead it is a low-level API to bind data to graphics elements and transform them based on that data. For example, D3 doesn't have one single function to create a pie chart. Rather, it has a function that processes your dataset with the necessary angles so that, if you pass the dataset to D3's arc function, you get the drawing code necessary to represent those angles. And you need to use yet another function to create the paths necessary for that code. It's a much longer process than using dedicated charting libraries, but the D3 process is also its strength. Although other charting libraries conveniently allow you to make line graphs and pie charts, they quickly break down when you want to make something more complicated than that. D3 allows you to build whatever data-driven graphics and interactivity you can think of.