Introduction
Cities in The Netherlands strive to have a clean environment where citizens can enjoy healthy living conditions. To that end cities must keep track of different air pollutants and then try to keep their values in check. The World Health Organization (WHO) specifies the set of parameters that need to be observed to monitor air quality, these are:
Air Quality Parameteers
| Acronym | Description |
|---|---|
| PM10 | Inhalable particles, with diameters that are generally 10 micrometers and smaller in μg/m3. |
| PM2.5 | Fine inhalable particles, with diameters that are generally 2.5 micrometers and smaller in μg/m3. |
| NO2 | Nitrogen dioxide in μg/m3 |
| SO2 | Sulfur dioxide in μg/m3 |
| CO2 | Carbon monoxide in μg/m3 |
In line with this need, pollution systems are being implemented to monitor outdoor air quality and take measurements of air pollution all over the country. Having monitoring systems in place provides the foundation for monitoring air quality (see 1).
But, having a monitoring network is just the first step. The real value of such a system comes when local governments and citizens alike are aware of pollution values and can use them to make informed decisions. The information required by them for these decisions is:
How different is the air quality along bike paths during peak hours and off-peak hours?
What are the neighborhoods of the city with the best and worst air quality along the year?
Which areas of the city have the most and least reliable air pollution data?
To provide this information to citizens and local authorities, you will need to obtain the data of the different pollutants, analyze it and produce the information products required for the above-mentioned questions. For this task, you need to:
- ❶ – Identify from the literature what are acceptable values of air quality to use as the basis of your analysis.
- ❷ – Select one Dutch municipality which has at least 4 sensors in the Luchtmeetnet network as your work area.
- ❸ – Identify the locations in the city where data about the relevant pollutants is being collected. Describe the data through maps, charts, data models, etc.
- ❹ – Obtain the required base data and air quality data (see 1), from official and community sources, for the chosen city, and organize it for analysis and processing.
- ❺ – Evaluate the quality of the data based on the spatial distribution of the sensors, their type (some provide more accurate observations than others.), and the actor responsible e.g., a professional organization, the community. You can do this for two of the parameters.
- ❻ – Select two relevant air quality variables and analyse their distributions according to methods and graphical tools for descriptive statistics. Describe the distribution of the data in qualitative terms. Are the distributions symmetric? Are they skewed? Or normal? Are there outliers? Compare the distributions of the two variables.
- ❼ – Generate the necessary products (maps, charts, etc.) to present the results to citizens and local authorities for decision making.
- ❽ – Describe the rational used to decide on harvesting data manually of programmatically, and for the programmatic cases submit the corresponding code.
The data that you need can be obtained from (but not exclusively) the sources provided here. To download the data, you can click your way through the various data portals, and/or you can programmatically submit requests using the corresponding APIs. There are also some example requests that demonstrate how to operate with the APIs. The API responses are generally encoded using JSON, but you can also obtain CSV encodings.
Grading
This assignment will be assessed using the following criteria:
| Criteria | Points |
|---|---|
| Description of air quality, problems associated with it, means to measure it, and mechanisms used in defining acceptable levels for different human activities. | 5 |
| Identification and description of the data needed to answer the questions. This includes thematic, spatial and temporal characteristics of the datasets. | 10 |
| Obtained, curated, and organized the necessary datasets. Argues and demonstrates that the collected data, and the method of harvesting from official and community sources, is sufficient/valid to address the problem at hand. Discusses the approach followed to fill in temporal or spatial data gaps. | 20 |
| In terms of community generated data, discusses its quality, usefulness, limitations, and means of improvement. | 10 |
| Correct use and clear interpretation of statistics, graphical tools and linear models. Providing a clear explanation of the techniques chosen and the validity of the results. | 30 |
| Description and justification of the chosen visualization products and the cartographic techniques used to produce them. | 20 |
| A well-written, concise, properly structured report, containing references, figures and the appropriate content with respect to the criteria of this rubric. | 5 |
Base Data
The main source of base data in the Netherlands is the Public Data Services platform best known as PDOK. PDOK provides access to all geodata sets of the Dutch government. The data is collected by both the public and private sectors. PDOK's services are based on open standards and are freely available to everyone.
Portal → https://app.pdok.nl/viewer/ Catalog → https://www.pdok.nl/datasets Metadata → https://www.nationaalgeoregister.nl/geonetwork/srv/eng/catalog.search#/home API-URL → https://service.pdok.nl
API end points:
Municipalities (gemeenten), districts (wijken) & neighborhoods (buurten)
{API-URL}/cbs/wijkenbuurten/2022/wfs/v1_0?SERVICE=WFS&REQUEST=GetCapabilities
Road network (nwbwegen)
{API-URL}/nwbwegen/wfs?SERVICE=WFS&VERSION=1.1.0&REQUEST=GetCapabilities
{API-URL}/nwbwegen/wfs?SERVICE=WFS&VERSION=1.1.0&REQUEST=DescribeFeatureType&TYPENAME=nwbwegen:wegvakken
Land cover units (bestandbodemgebruik)
{API-URL}/cbs/bestandbodemgebruik/2017/wfs/v1_0?SERVICE=WFS&VERSION=2.0.0&REQUEST=GetCapabilities
{API-URL}/cbs/bestandbodemgebruik/2017/wfs/v1_0?SERVICE=WFS&VERSION=2.0.0&REQUEST=DescribeFeatureType&TYPENAME=bestandbodemgebruik:BBG2017
OpenStreetMap data:
Overpass → https://overpass-api.de/api/map? Geofabrik → https://download.geofabrik.de/
Air Quality Data
The Dutch air quality monitoring network (Lucht MeetNet) consists of a series of measuring networks that provide unvalidated measurements openly to the general public. Measurements are obtained hourly, but the timing differs per network.
Portal → https://www.luchtmeetnet.nl/ API → https://api.luchtmeetnet.nl/open_api/ API docs → https://api-docs.luchtmeetnet.nl/ Information → https://www.luchtmeetnet.nl/informatie/download-data/open-data
The Measuring Together program (Samen Meten) of the National Institute for Public Health and the Environment (RIVM) is an initiative to provide access to air quality and noise measurements collected by individuals using low-cost sensors.
Portal → https://samenmeten.rivm.nl/dataportaal/ API → https://api-samenmeten.rivm.nl/v1.0/ API docs → https://gost1.docs.apiary.io/
OpenSenseMap is a platform for storing, exploring, analyzing, publishing and visualizing environmental sensor data collected by individuals.
Info → https://sensebox.de/en/ Portal → https://opensensemap.org/ API → https://api.opensensemap.org/ API docs → https://docs.opensensemap.org/
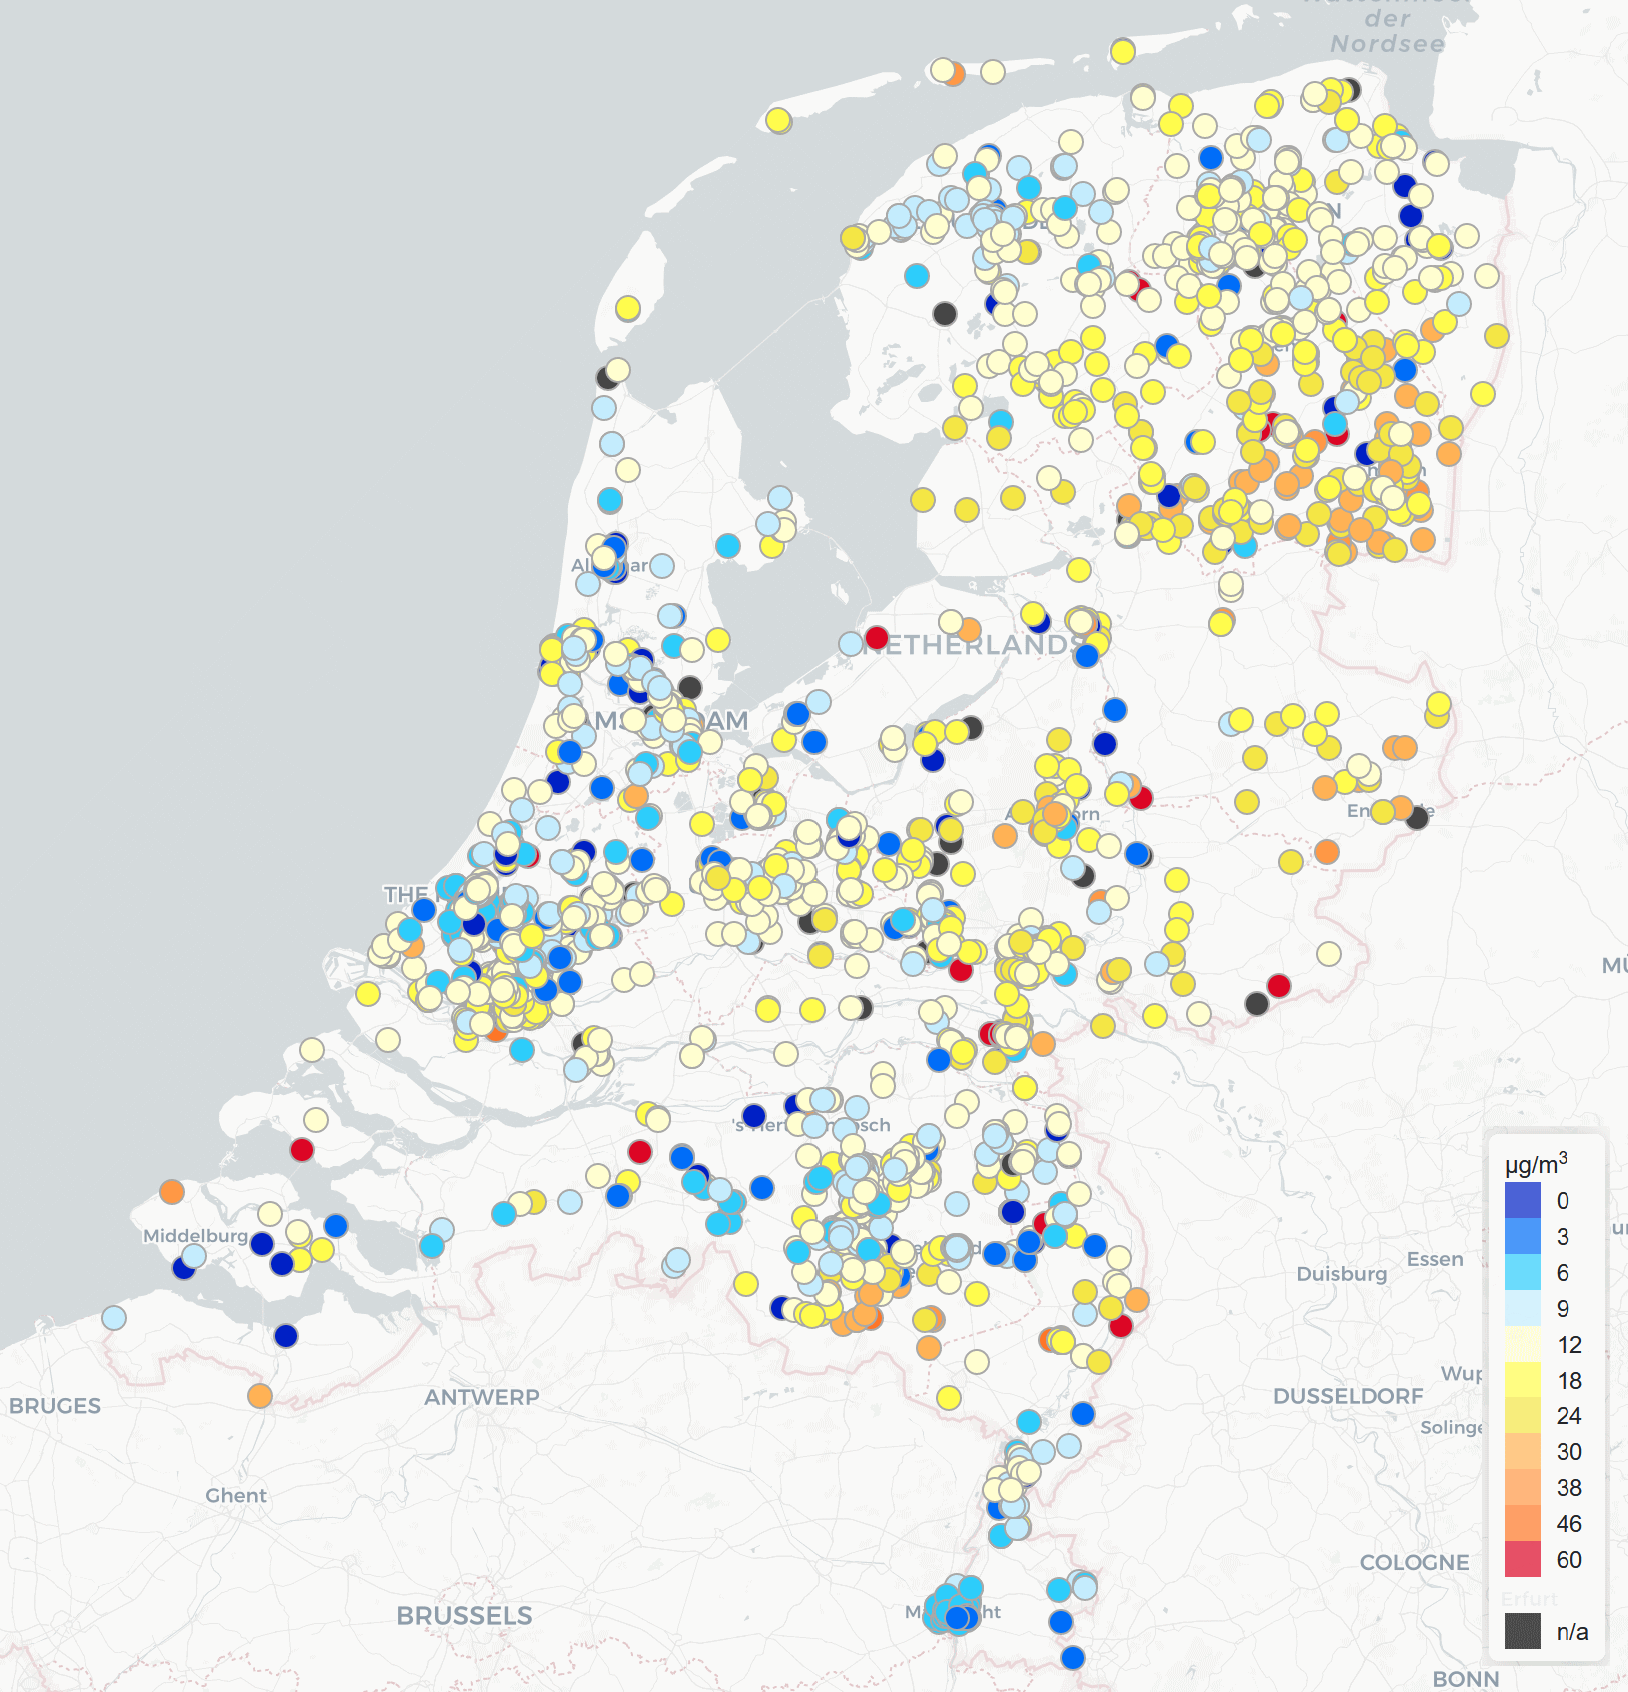
World's Air Pollution: Real-time Air Quality Index.
Portal → https://waqi.info/#/c/52.357/5.545/7.9z
Air Quality Monitoring
An interesting video introducing air quality monitoring by the European Space Agency.