Web Maps 1: Openlayers
Thus far we have seen how to add standard static content to the page, such as text, figures, menus, etc. We have also seen how to apply style to the page's elements to improve the look and feel of the page. Following the design of our page we now need to create a map. When it comes to programming in the browser there is only one option, so we will be using JavaScript for all the scripting related with the browser. We will therefore need to create and include in the page our own Javascript. To add mapping functionality to the page we also need to include a JavaScript library that provides the appropriate functionality. In this case we will use OpenLayers.
To get introduced to the use of Javascript and the OpenLayers Javascript library, you should have (first) done the exercises "Introduction to client-side Javascript" and "Creating a webmap client using OpenLayers"...Listing 1 shows the necessary modifications to the simple-website/data-viewer.html file.
|
1 2 3 4 5 6 7 8 9 10 11 12 13 14 15 16 17 |
dotdotdot <link rel="stylesheet" href="styles/main.css" type="text/css" media="screen" /> <link rel="stylesheet" href="styles/viewer.css" type="text/css" media="screen" /> <link rel="stylesheet" href="https://gisedu.itc.utwente.nl/exercise/libraries/openlayers/v4.6.4/ol.css" type="text/css"/> <!-- scripts --> <script src="https://gisedu.itc.utwente.nl/exercise/libraries/openlayers/v4.6.4/ol.js"></script> <script src="scripts/viewer.js"></script> </head> <body onload="init()"> <section class="container header"> <header> dotdotdot |
Besides adding the necessary JavaScript code to the page, in line 13 we associate the init()
function with the onload event of the page. This function is triggered by the onload
event of a page, it will be executed when the page finishes its loading process, which is exactly when we need
our init() function to be executed.
Basic Map Elements
The HTML to display a map is already in place: the div id="mapcontainer" in the data-viewer.html
code. What we need to do is to apply to it some style rules so that it renders nicely in the page. We can use
the #map_container CSS selector and apply the style rules. Insert the following rule at the end
of the simple-website/styles/viewer.css file:
|
1 2 3 4 5 6 7 8 9 10 |
/*---------*/ /* Web Map */ /*---------*/ #map_container { width:100%; height:500px; border:1px solid #ccc; padding:2px !important; margin:10px 0 20px 0 !important; } |
With the map container in place, we can proceed to create the map object. You'll follow the same procedure as you did in the introductory OpenLayers exercise. But this time we will not include the OpenLayers scripting in the HTML file itself, but instead separate it using a standalone script file. Create a directory and a file inside it: simple-website/scripts/viewer.js. Then to create the map object, insert the following code in this file.
|
1 2 3 4 5 6 7 8 9 10 11 12 13 14 15 16 17 18 19 20 21 22 23 24 25 26 27 28 29 30 31 32 33 34 |
/*---------------------------------------------------------------- Name: viewer.js Date: November 2019 Description: Base code for the - Web Programming - exercise (data viewer page) Version: 2.1 ----------------------------------------------------------------*/ var navMap; /*-- Initialization function --*/ function init() { //define map object & link to placeholder div: navMap = new ol.Map({target: "map_container"}); // define layer as tiled map: osmLayer = new ol.layer.Tile({ // load OSM (a connector predefined in the API) as source: source: new ol.source.OSM() }); // add layer to map: navMap.addLayer(osmLayer); // create a map view: navMap.setView( //center coords and zoom level: new ol.View({ center: ol.proj.transform([5.53, 52.13], 'EPSG:4326', 'EPSG:3857'), zoom: 7 }) ); navMap.addControl(new ol.control.Zoom()); navMap.addControl(new ol.control.MousePosition()); } /*---*/ |
In this part of the exercise we use, like in the earlier introduction to OpenLayers exercise, the popular map services of OpenStreetMap. We configure our map object similar to that earlier exercise. In lines 23–29, we specify the parameters for the map view, including the zoom level and the center coordinates to focus the view in The Netherlands. Although spherical Mercator will be the default projection of our map, the data that we later will overlay on the map comes in WGS84. This means that we will need to perform coordinate transformations at different moments in the application. For example, in line 26, we define the center coordinates of the map. The coordinates are given in WGS84 (EPSG:4326) and are transformed to the display projection of the map (EPSG:3857) using an OpenLayers function. If you want to learn more about the Spherical Mercator projection and how to use it in combination with other mapping services head to [http://docs.openlayers.org/library/spherical_mercator.html]
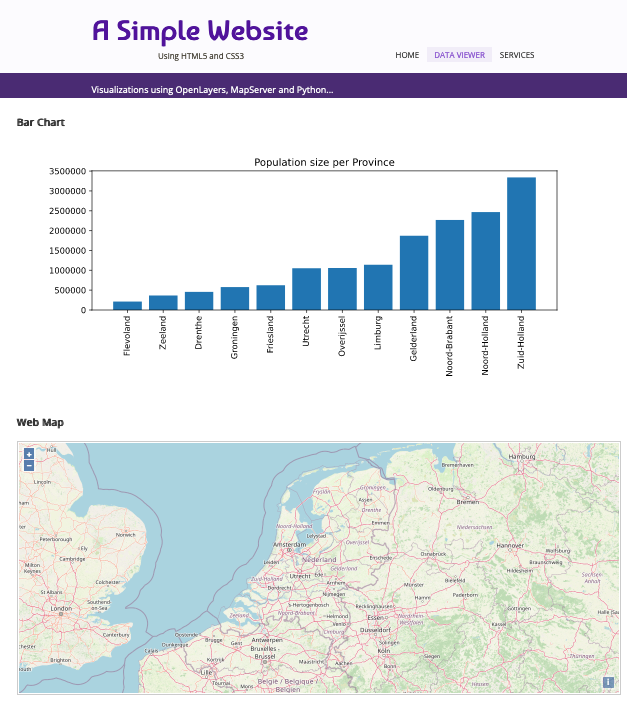
You can now reload the page to see the result of adding a map object and a base layer. The result should be comparable to the image shown in Figure 1. Check the behaviour of the mouse position and zoom controls.
You might have noticed that the default format and projection of the coordinates for the mouse position are in EPSG:3857, which is not very friendly or even informative for the user. We should certainly do something about it so that the numbers shown actually make some sense. To do that end we will manipulate the control's parameters. Update the simple-website/scripts/viewer.js file by adding the following code.
|
1 2 3 4 5 6 7 8 9 10 11 12 13 14 15 |
dotdotdot zoom: 7 }) ); navMap.addControl(new ol.control.Zoom()); navMap.addControl(new ol.control.MousePosition({ projection: 'EPSG:4326', coordinateFormat: ol.coordinate.createStringXY(4) }) ); }; /*---*/ |
To manipulate the format of the coordinates, we have changed the projection property of the control and also specified a format with four decimal positions for the values. The result should make the coordinates values much more useful or understandable, try it out.
Intermezzo...
At this stage you have created a basic web page with HTML and CSS, and added a Javascript API for webmaps (OpenLayers) to create an interactive map viewer. The next step is to add your own Python Geowebservices to the site. As (most of) you have not used Python to create webservices before, we now first will do the introductory exercises for these technologies: We will return to the next Section after that...