Including a Bar Chart
In this section you will learn how to add a picture of a Bar Chart. In this first simple case, you will use an existing static graphic. In later parts you will learn how to create a dynamic chart, by implementing a Python service to create a chart using MatPlotLib...
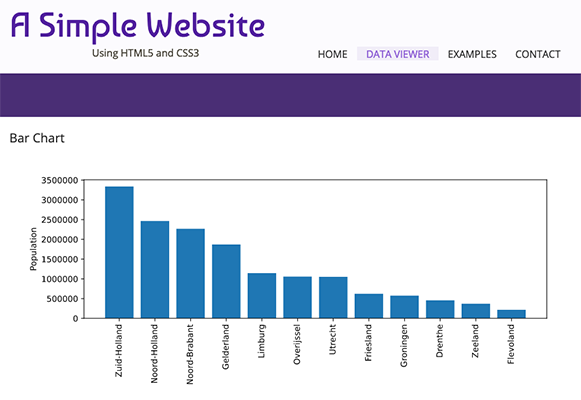
About the graph
For the graph, we can use any existing one, for example created by Excel, or by using Python's MatPlotLib. We do not teach you how to do that here, instead offer you a bar graph of population data per province in the Netherlands as a download:
SAVE pop_chart.svg in your web directory...
MatPlotLib can save figures in a great many formats, depending also on the backend that is used by your Python installation. For an overview, see the matplotlib API documentation. The default is usually a PNG raster file. But as we are creating web content, we prefer to use SVG (Scalable Vector Graphics), the HTML5 standardised vector format.
Using the graph
Now we can include the barchart in our web page. Edit the HTML file data-viewer.html you have created before in the exercises. Add the line highlighted in the listing below to the code. If you now reload the page it should have the bar-chart included, as shown in the figure below...
|
1 2 3 4 5 6 7 8 9 10 11 12 13 14 |
dotdotdot <!-- Chart Section --> <section class="one-column"> <article id="bar_chart"> <h2>Bar Chart</h2> <div id="chart_container"> <img id="population_chart" src="pop_chart.svg"> </div> </article> <!-- bar_chart --> <br class="clear"/> </section> dotdotdot |
Intermezzo...
At this stage you have created a basic web page with HTML and CSS. In the next sections, you will learn how to use a Javascript API for webmaps (OpenLayers) to create an interactive map viewer. As (most of) you have not used Javascript before, we advice you to now first do the introductory exercises for these technologies: "Introduction to client-side Javascript" and "Creating a webmap client using OpenLayers" We will return to the next Section after that...