The Transport View
The idea of the transport view is to generate a visualization based on a open data feed that provides near real-time data on the public transport system in The Netherlands. Just like with the previous cases, this content requires its own view object and also a controller. Create the file for the TransportView. The file for this view should be called CityApp/app/view/transport/TransportView.js. The code for the view is included in Listing 8-1.
|
1 2 3 4 5 6 7 8 9 10 11 12 13 14 15 16 17 18 19 20 21 22 23 24 25 26 27 28 |
/*--- Transport View ---*/ "use strict"; Ext.define('CityApp.view.transport.TransportView', { extend: 'Ext.panel.Panel', xtype: 'transportview', requires: [ 'CityApp.view.transport.TransportController' ], itemId: 'transport_view', id: 'transport_view', controller: 'transport-main', layout: 'fit', border: false, bodyPadding: 2, items: [{ xtype: 'panel', layout: 'fit', id: 'txp_map_panel' }] }); /*--- ---*/ |
This view will only contain one panel, which fills the whole page. We will fill this panel with a map. Now, create the CityApp/app/view/transport/TransportController.js file for the controller of this view (see Listing 8-2).
|
1 2 3 4 5 6 7 8 9 10 11 12 13 14 |
/*--- Transport controller ---*/ "use strict"; Ext.define('CityApp.view.transport.TransportController', { extend: 'Ext.app.ViewController', alias: 'controller.transport-main', init: function(){ CityApp.app.txpCtrl = this; } /*---*/ }); /*--- ---*/ |
Nothing new to discuss here. Like we did with the other controllers, we have defined a global variable pointing to this controller 10, which we need to declare. Update the CityApp/app/Application.js with the new declaration as shown in Listing 8-3.
|
1 2 3 4 5 6 7 8 9 10 11 12 13 14 15 16 17 18 19 |
dotdotdot extend: 'Ext.app.Application', appFolder: 'app', requires: [ 'CityApp.store.Districts', 'CityApp.store.Colors' ], stores: [ 'Districts', 'Colors' ], homeCtrl : null, stsCtrl: null, txpCtrl: null, cityName: 'Enschede', dotdotdot |
Now we attach the new view to the application by updating the CityApp/app/view/home/HomeView.js file as shown in Listing 8-4.
|
1 2 3 4 5 6 7 8 9 10 11 12 13 14 15 16 17 18 19 20 21 22 23 24 25 26 27 28 29 30 31 32 33 34 |
/*--- Home View ---*/ Ext.define('CityApp.view.home.HomeView', { extend: 'Ext.container.Viewport', requires: [ 'CityApp.view.home.HomeController', 'CityApp.view.statistics.StatisticsView',MMSSGG001 'CityApp.view.transport.TransportView' ], controller: 'home-main', itemId: 'home_view', id: 'home_view', padding: 2, layout: 'fit', items: [{ xtype: 'tabpanel', activeTab: 1, items: [{ xtype: 'panel', html: 'Planning...', title: ' Participatory Planning ' },{ xtype: 'transportview', title: ' Public Transport ' },{ xtype: 'statisticsview', title: ' Basic Statistics ' }] }] }); |
Nothing new to discuss here either. Note that we have change the active tab so that the first tab that is displayed is the one we are working on. Reload the application.
Repeat the process we used for the map creation process of the statistics view, to create a map for this view. All you need is to add to the TransportController: a map variable; an initialization function associated to the proper event; and, a call to the createMap function of the HomeController, from within this controller's initialization function (Check Listings 4-7, 4-8 and 4-12.). The result of your changes should look similar to the image in Figure 8-1.

Well, if your application's look and feel resembles Figure 8-1, congratulations, you have done a very good job. Let us move forward then.
The Transit Feed
Now, let us focus on the data. For this view we are going to use an open data feed from transit-agancies in the netherlands YOu can find detail information on the data feed at: http://gtfs.ovapi.nl/README. The data comes in GTFS format, whcih is a common format for the publication of transportation schedules. You can read about it at: https://developers.google.com/transit/gtfs/.
Accessing this feed from within our application is not possible due to the standard cross-domain restrictions of the Web. To be able to use it we hav to create a server-side script. This script will work as a proxy between the data feed provider and our application. The code of the script is shown in Listing 8-5. Use the code in the listing to create the CityApp/app/api/transitfeed.py file.
|
1 2 3 4 5 6 7 8 9 10 11 12 13 14 15 16 17 18 19 20 21 22 23 24 25 26 27 28 29 30 31 32 33 34 35 36 37 38 39 40 41 42 43 44 45 46 47 48 49 50 51 52 53 54 55 56 57 58 59 60 61 62 63 64 65 66 67 68 69 70 71 72 73 |
# Retrieve vehicle locations via a GTFS import os, cgi import urllib.request import geojson import psycopg2 from psycopg2.extras import RealDictCursor from google.transit import gtfs_realtime_pb2 from pyproj import Proj, transform from geojson import Feature, Point, FeatureCollection def routesearch(route_id, routes): return [route for route in routes if route['route_id'] == int(route_id)] print ("Content-type: application/json") print () params = cgi.FieldStorage() if (params.getvalue('bbox')): coords = params.getvalue('bbox').split(",") else: coords = [250000, 466000, 266000, 476000] file = open(os.path.dirname(os.path.abspath(__file__)) + "\pg.credentials") connection_string = file.readline() + file.readline() pg = psycopg2.connect(connection_string) query = pg.cursor(cursor_factory=RealDictCursor) query.execute(""" SELECT route_id, route_short_name AS short_name, route_long_name AS long_name FROM transport.route ORDER BY route_id """) routes = query.fetchall() feed = gtfs_realtime_pb2.FeedMessage() response = urllib.request.urlopen('http://gip.itc.utwente.nl/exercises/data_sources/vehiclePositions.pb') feed.ParseFromString(response.read()) inProj = Proj(init='epsg:28992') outProj = Proj(init='epsg:4326') x1rd,y1rd = coords[0],coords[1] x1wgs,y1wgs = transform(inProj,outProj,x1rd,y1rd) x2rd,y2rd = coords[2],coords[3] x2wgs,y2wgs = transform(inProj,outProj,x2rd,y2rd) features = [] for entity in feed.entity: if x1wgs < entity.vehicle.position.longitude and entity.vehicle.position.longitude < x2wgs: if y1wgs < entity.vehicle.position.latitude and entity.vehicle.position.latitude < y2wgs: props = entity.id.split(":") route_data = routesearch(entity.vehicle.trip.route_id, routes) if len(route_data) > 0: route_data = route_data[0] else: route_data = {} route_data['short_name'] = entity.vehicle.trip.route_id route_data['long_name'] = 'Unknown' feature = Feature( geometry = Point((entity.vehicle.position.longitude, entity.vehicle.position.latitude)), properties = { "trip_id": entity.vehicle.trip.trip_id, "company": props[1], "route_id": entity.vehicle.trip.route_id, "route_code": route_data['short_name'], "route_name": route_data['long_name'], "vehicle_id": entity.vehicle.vehicle.label, "timestamp": None }, id = entity.vehicle.vehicle.label ) features.append(feature) feature_collection = FeatureCollection(features) print (geojson.dumps(feature_collection)) |
This script is primarily informative. A couple of important things are: the script expects a bounding box as a parameter. This bounding box represents the area for which data is expected; the script returns a FeatureCollection in GeoJSON format; To reduce network traffic during the execution of the exercise, we will use a virtual version of the data feed located in one of our servers, rather than the feed from the original source (http://gtfs.ovapi.nl/). Let us test the service using the following URL.
https://gisedu.itc.utwente.nl/student/<<SNUMBER>>/CityApp/app/api/transitfeed.py
This example request does not include a bounding box therefore the service will use the default bounding box that is coded in the service's script. Later we can check if the service also works when a bbox parameter is provided.
The Vehicles Layer
The response of the transitfeed service can be used to include a vector layer on the map of the transit view. We will place the code for the layer inside the initialization function as shown in Listing 8-6. Use the code to update the CityApp/app/view/transport/TransportController.js file.
|
1 2 3 4 5 6 7 8 9 10 11 12 13 14 15 16 17 18 19 20 21 22 23 24 25 26 27 28 29 30 31 32 33 34 35 36 37 38 39 40 41 42 43 44 45 |
dotdotdot Ext.define('CityApp.view.transport.TransportController', { extend: 'Ext.app.ViewController', alias: 'controller.transport-main', txpMap: null, vehicleLayer: null, interval: null, deployed: false, init: function(){ CityApp.app.txpCtrl = this; dotdotdot /*- Performs initialization actions after the view has been rendered -*/ initializeView: function(){ dotdotdot var defaultStyle = new ol.style.Style({ image: new ol.style.Circle({ radius: 5, fill: new ol.style.Fill({ color: 'rgba(0, 200, 0, 0.2)' }), stroke: new ol.style.Stroke({ color: '#009900', width: 2 }) }) }); this.vehicleLayer = new ol.layer.Vector({ source: new ol.source.Vector({ features: (new ol.format.GeoJSON()) }), style: defaultStyle }); this.txpMap.addLayer(this.vehicleLayer);MMSSGG010 } /*---*/ }); /*--- ---*/ |
This code will basically create a layer with no features for now. Later we will add features to this layer using the data from the transit feed.
Remember to adapt the code presented in the listings to your own. For example, use your own variable as a replacement for the txpMap variable in the listings, or rename your variable to match the listings. Reload the application and check the console to make sure that there are no error messages.
To take the next step we need to decide when are we going to retrieve the data from the feed. There are basically three moments when this should happen. 1) when the map extent changes (this includes the first time when it is rendered). 2) when a certain amount of time has pass since the last time the feed was read. 3) when the transport view receives focus. Let us code for cases one and two. If we check the documentation of OpenLayers, we observe that a change in the map extent will trigger the moveend event. We can associate that event with a function and use that function to read the feed. Listing 8-7 shows the code to associate the map's moveend event with a function, which should be included in the CityApp/app/view/transport/TransportController.js file.
|
1 2 3 4 5 6 7 8 9 10 11 12 13 14 15 16 17 18 19 20 21 22 23 24 25 26 27 28 29 30 31 |
dotdotdot this.vehicleLayer = new ol.layer.Vector({ source: new ol.source.Vector({ features: (new ol.format.GeoJSON()) }), style: defaultStyle }); this.txpMap.addLayer(this.vehicleLayer); this.txpMap.on('moveend', this.refreshVehicleLayer); },MMSSGG001 /*---*/ /*- Reconfigures the interface for the retrieval of vehicle positions -*/ refreshVehicleLayer: function(){ CityApp.app.txpCtrl.getVehiclePositions( CityApp.app.txpCtrl.txpMap.getView().calculateExtent() ); CityApp.app.txpCtrl.interval = setInterval( function(){ CityApp.app.txpCtrl.getVehiclePositions( CityApp.app.txpCtrl.txpMap.getView().calculateExtent() ); }, 60000 ); } /*---*/ }); /*--- ---*/ |
The refreshVehicleLayer function, does two things. It calls the function to read the data feed, and then it schedules the next call to take place every minute afterwards. The code for the getVehiclePositions function, which is the function that reads the transport feed is shown in Listing 8-8. Use it to update the CityApp/app/view/transport/TransportController.js file.
|
1 2 3 4 5 6 7 8 9 10 11 12 13 14 15 16 17 18 19 20 21 22 23 24 25 26 27 28 29 30 31 32 33 34 35 36 37 38 39 40 41 42 43 44 45 46 47 48 49 50 51 52 53 54 55 56 57 58 59 60 |
dotdotdot this.txpMap.addLayer(this.vehicleLayer); this.txpMap.on('moveend', this.refreshVehicleLayer); }, /*---*/ /*- Reads a new transit feed */ getVehiclePositions: function(bboxCoords){ Ext.Ajax.request({ url: 'app/api/transitfeed.py?bbox=' + bboxCoords, disableCaching: false, success: function(response){ CityApp.app.txpCtrl.updateVehiclePositions(JSON.parse(response.responseText)); }, failure: function(response){ console.log('error: '+response.status); } }); }, /*---*/ /* Updates the features in the vehicle layer with their new positions from the feed -*/ updateVehiclePositions: function(vehiclePositions){ var feature, layerSource, updateTime; updateTime = Date.now(); layerSource = this.vehicleLayer.getSource(); vehiclePositions.features.forEach(function(vehicle){ feature = layerSource.getFeatureById(vehicle.id); if (feature){ /* update geomtery if the feature exists */ feature.setGeometry( new ol.geom.Point([vehicle.geometry.coordinates[0],vehicle.geometry.coordinates[1]]) .transform('EPSG:4326','EPSG:28992') ); } else { /* create new features */ feature = new ol.Feature(); feature.setGeometry( new ol.geom.Point([vehicle.geometry.coordinates[0],vehicle.geometry.coordinates[1]]) .transform('EPSG:4326','EPSG:28992') ); feature.setId(vehicle.id); feature.setProperties(vehicle.properties); layerSource.addFeature(feature); }; feature.set('timestamp', updateTime); }); layerSource.forEachFeature(function(feature){ /* remove features that are no longer in the feed */ if (feature.get('timestamp') < updateTime){ layerSource.removeFeature(feature); }; }); }, /*---*/ /*- Reconfigures the interface for the retrieval of vehicle positions -*/ refreshVehicleLayer: function(){ txpCtrl.getVehiclePositions(txpCtrl.txpMap.getView().calculateExtent()); dotdotdot |
The getVehiclePositions function uses an AJAX request to read the data feed using the bounding box coordinates passed on from the function called. The updateVehiclePositions function is assigned as the callback function responsible to handle the response to the request. With that response, the updateVehiclePositions function adds new features to the vehicle later or updates the features that have been added before. Every new or updated feature from the current response from the feed gets its timestamp updated 47. If after processing the response from the feed there are features which timestamps were not update. It means they are no longer valid and then are removed from the layer 49–51.
One important issue here is that the map uses RD new coordinates (EPSG:28992) and the data from the feed is in WGS84 (EPSG:4326). That means we need to transform the coordinates of the feed before features can be added to the map 33–36, 39–42. OpenLayers is fully capable of handling coordinates in EPSG:4326, but it does not know the transformation parameters for EPSG:28992. To be able to transform the coordinates as needed by the application we have to include those parameters. Use Listing 8-9 to create the CityApp/projdefs/epsg28992.js file.
|
1 2 3 |
proj4.defs("EPSG:28992", "+proj=sterea +lat_0=52.15616055555555 +lon_0=5.38763888888889 " + "+k=0.9999079 +x_0=155000 +y_0=463000 +ellps=bessel +towgs84=565.417,50.3319,465.552,-0.398957," + "0.343988,-1.8774,4.0725 +units=m +no_defs"); |
Now we need to include in the application the transformation parameters for EPSG:28992, and the javascript projection library. Upadate the CityApp/index.html with the code in Listing 8-10.
|
1 2 3 4 5 6 7 8 9 10 11 12 13 |
dotdotdot <link rel="stylesheet" href="/exercise/libraries/openlayers/v4.6.4/ol.css"/> <script src="/exercise/libraries/openlayers/v4.6.4/ol.js"></script> <script src="/exercise/libraries/proj4js/v2.4.3/proj4.js"></script> <script src="/exercise/libraries/d3js/v4.13.0/d3.min.js"></script> <!-- Application Files --> <link rel="stylesheet" href="styles/main.css"/> <script src="projdefs/epsg28992.js"></script> <script src="init.js"></script> dotdotdot |
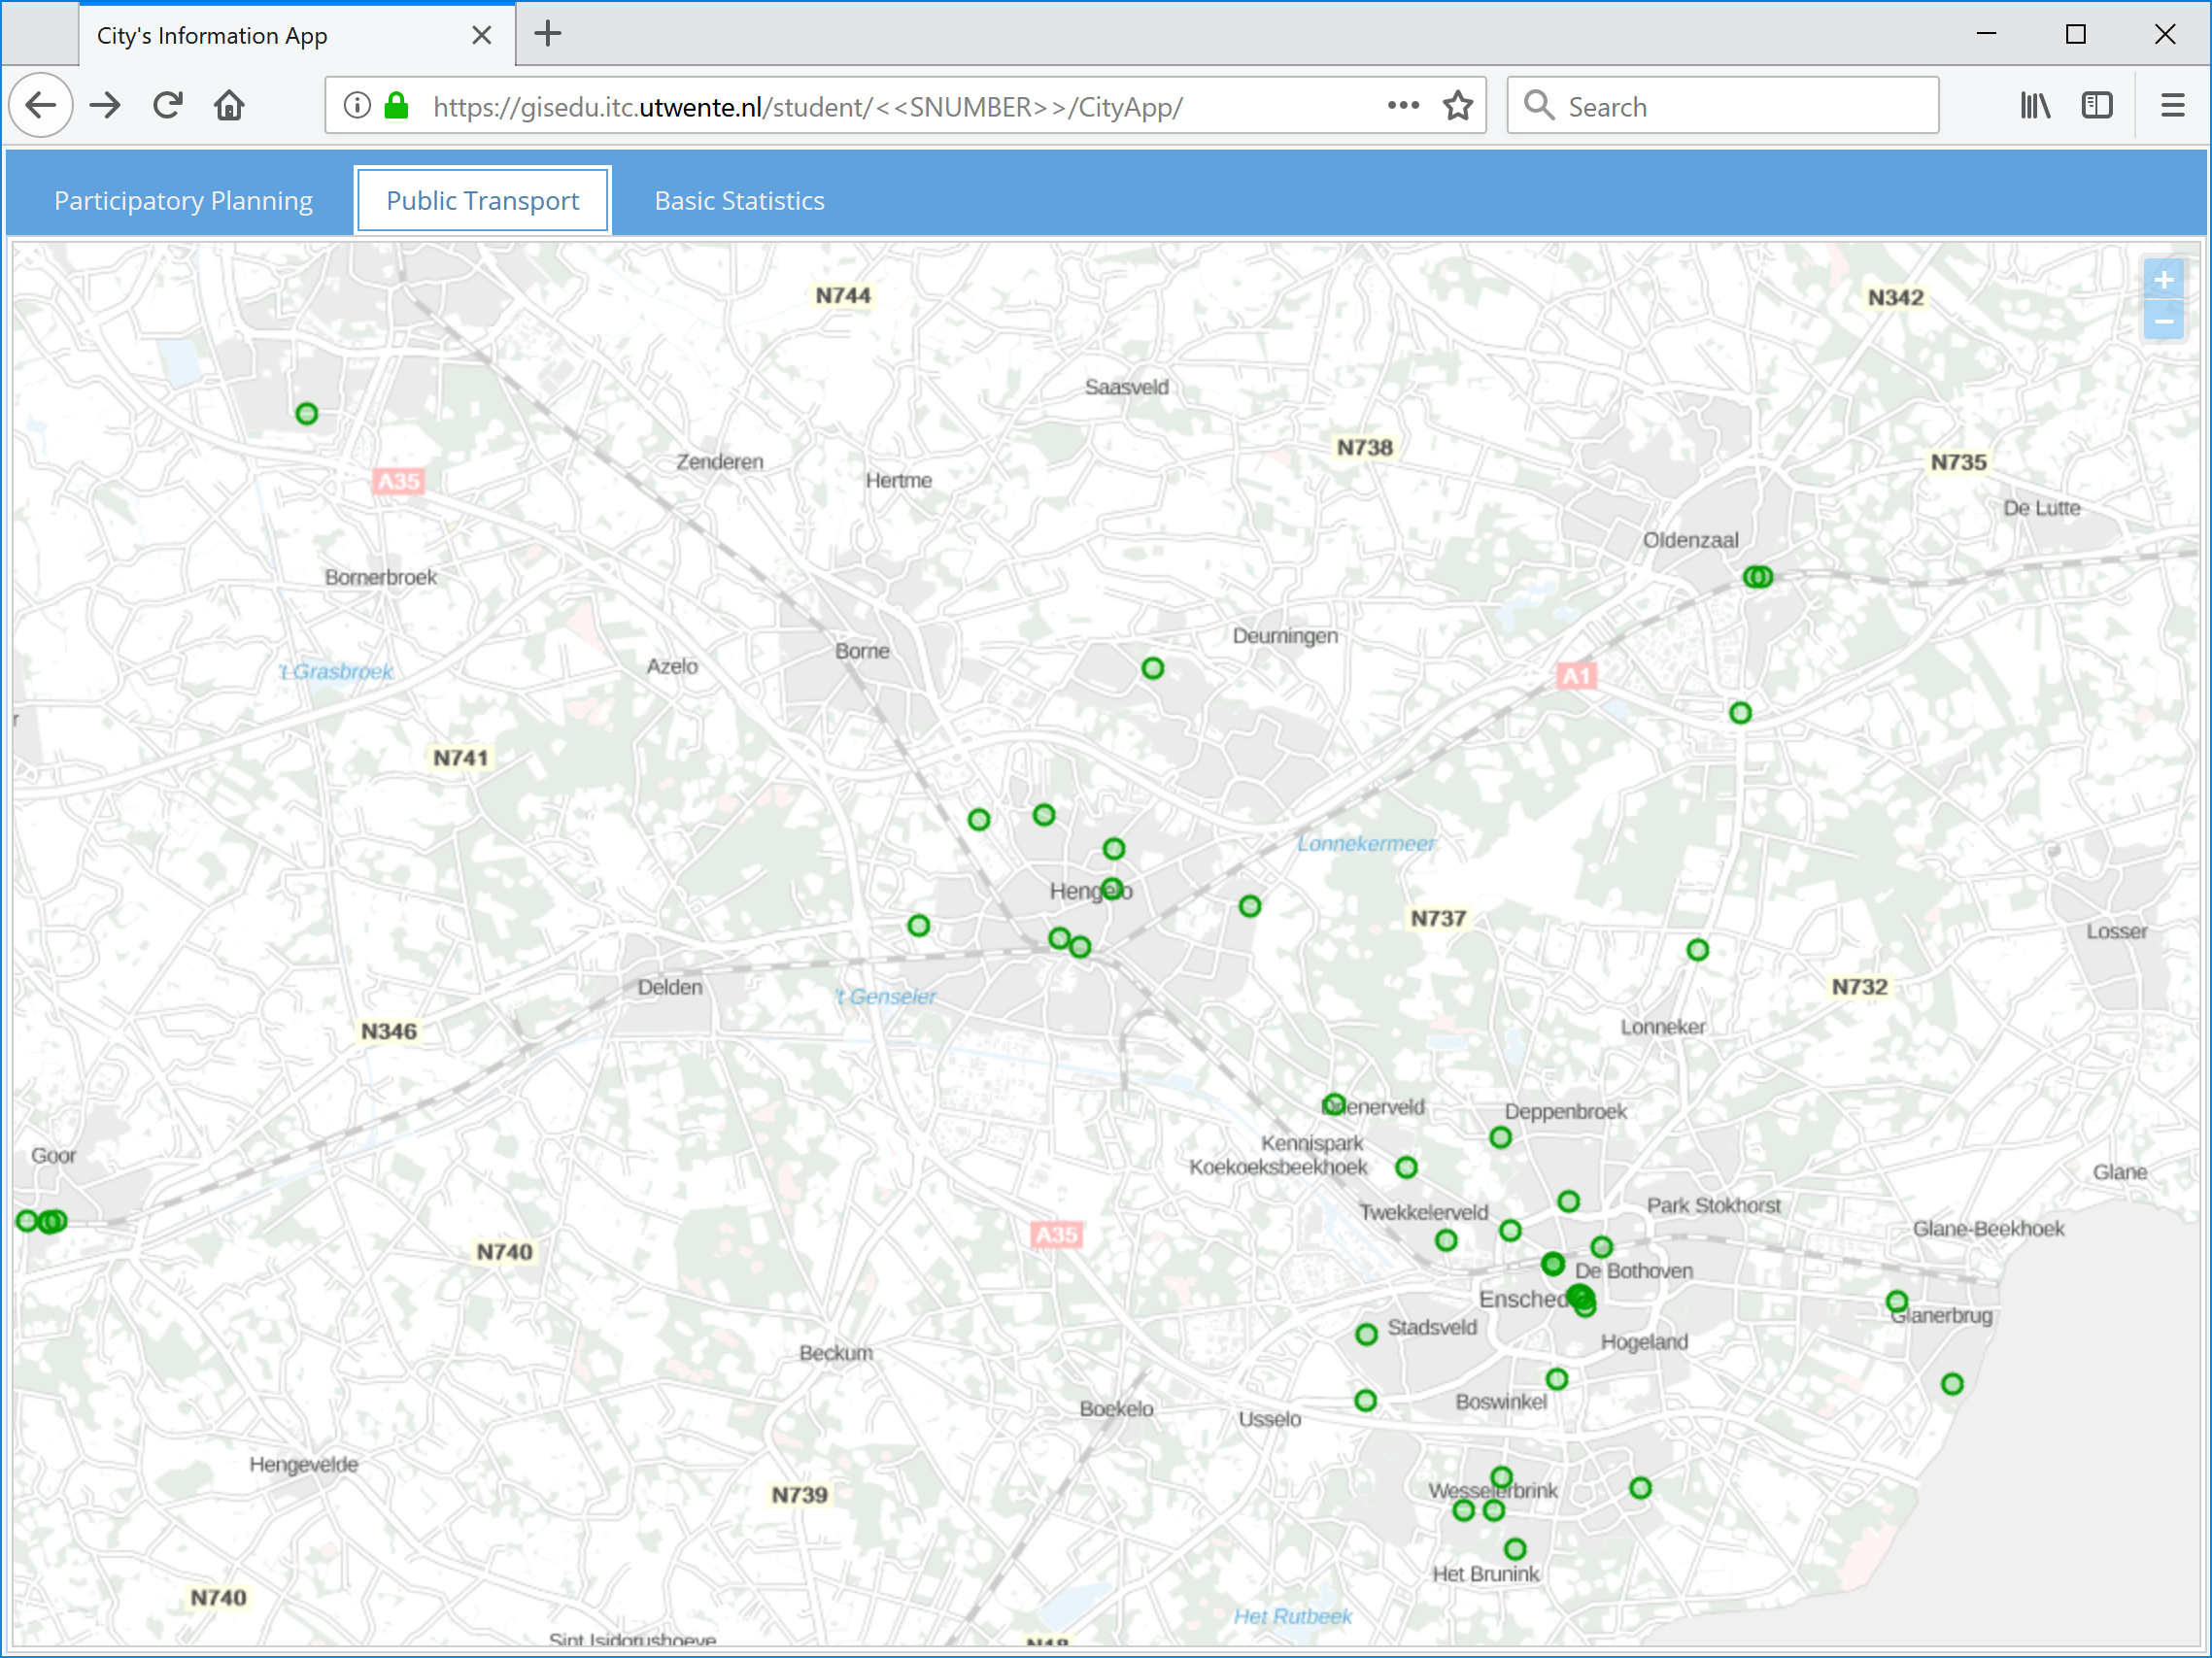
Reload the application now. The new result should now include point markers for the various points that were available in the feed. Your application should look similar to Figure 8-2, that is, with some points representing public transport.
We will use an interaction object to display data about each point when the user hovers over one of the points. Update the CityApp/app/view/transport/TransportController.js file as shown in Listing 8-11.
|
1 2 3 4 5 6 7 8 9 10 11 12 13 14 15 16 17 18 19 20 21 22 23 24 25 26 27 28 29 30 31 32 33 34 35 36 37 38 39 40 41 42 43 44 45 46 47 48 49 50 51 52 53 54 55 |
dotdotdot this.vehicleLayer = new ol.layer.Vector({ source: new ol.source.Vector({ features: (new ol.format.GeoJSON()) }), style: defaultStyle }); this.txpMap.addLayer(this.vehicleLayer); function hoverStyle() { return function(feature){ return new ol.style.Style({ image: new ol.style.Circle({ radius: 5, fill: new ol.style.Fill({ color: 'rgba(255, 0, 102, 0.2)' }), stroke: new ol.style.Stroke({ color: '#ff0066', width: 2 }) }), text: new ol.style.Text({ textAlign: 'center', textBaseline: 'middle', font: 'Normal 16px Arial', text: feature.get('route_code') + '\n' + feature.get('route_name'), fill: new ol.style.Fill({color: '#ff0066'}), stroke: new ol.style.Stroke({color: '#fff', width: 3}), offsetX: 0, offsetY: -26, rotation: 0 }) }); }; }; var hoverInteraction = new ol.interaction.Select({ layers: [this.vehicleLayer], condition: ol.events.condition.pointerMove, style: hoverStyle() }); this.txpMap.addInteraction(hoverInteraction); this.txpMap.on('moveend', this.refreshVehicleLayer); }, /*---*/ /*- Reads a new transit feed */ getVehiclePositions: function(bboxCoords){ Ext.Ajax.request({ dotdotdot |
Reload the application and test the hover interaction. Next, we will make sure the map is redrawn in case the browser window is resized. Use the code in Listing 8-12 to update the CityApp/app/view/transport/TransportController.js file.
|
1 2 3 4 5 6 7 8 9 10 11 12 13 14 15 16 17 18 19 20 21 22 23 24 25 26 27 28 29 |
dotdotdot init: function(){ txpCtrl = this; this.control({ 'panel#txp_map_panel': { 'resize': 'onMapPanelResize' }, 'transportview': { 'boxready': 'initializeView' } }); }, /*---*/ /*- Refreshes the map when its containing panel is resized -*/ onMapPanelResize: function(){ if (this.txpMap){ this.txpMap.updateSize(); }; }, /*---*/ /*- Performs initialization actions after the view has been rendered -*/ initializeView: function(){ dotdotdot |
Try resizing the browser to see that the map behaves properly. Pay attention to the console, you will see that as a response to the resize action, a new request to the data feed is made.
Now we will take care of disabling the periodic request to the feed, when the user is not using the transport tab, and also to update the points when the transport tab is active again. Update the CityApp/app/view/home/HomeController.js file as shown in Listing 8-13.
|
1 2 3 4 5 6 7 8 9 10 11 12 13 14 15 16 17 18 19 20 21 22 23 24 25 26 27 28 29 |
dotdotdot init: function() { CityApp.app.homeCtrl = this; this.control({ 'tabpanel': { 'tabchange': 'onTabPanelChange' } }); }, /*---*/ /*- Enables or desables the transit feed request on tab changes -*/ onTabPanelChange: function(tabpanel, newTab, oldTab){ var txpCtrl = CityApp.app.txpCtrl; if (newTab.id == 'transport_view'){ (txpCtrl.deployed) ? txpCtrl.refreshVehicleLayer() : txpCtrl.deployed = true; } else { if (oldTab.id == 'transport_view') { clearInterval(txpCtrl.interval); } }; }, /*---*/ /*- Creates and returns a new ol map object using the given panel -*/ createMap: function(baseMap, mapPanel){ dotdotdot |
Finally we will also disable the request to the data feed when the user switches to another web page or to another application. Include the code in Listing 8-14 in the CityApp/app/view/home/HomeController.js file.
|
1 2 3 4 5 6 7 8 9 10 11 12 13 14 15 16 17 18 19 20 21 22 23 24 25 26 27 28 29 30 31 32 |
dotdotdot init: function() { homeCtrl = this; this.control({ 'tabpanel': { 'tabchange': 'onTabPanelChange' } }); window.onblur = this.onFocusChange; window.onfocus = this.onFocusChange; }, /*---*/ /*- Enables of desables the transit feed request on changes of focus on the app window -*/ onFocusChange: function(appState){ var activeTab; var txpCtrl = CityApp.app.txpCtrl; activeTab = Ext.ComponentQuery.query('#home_view tabpanel')[0].activeTab; if (activeTab.id == 'transport_view'){ (appState.type == 'focus') ? txpCtrl.refreshVehicleLayer() : clearInterval(txpCtrl.interval); }; }, /*---*/ /*- Enables of desables the transit feed request on tab changes -*/ onTabPanelChange: function(tabpanel, newTab, oldTab){ dotdotdot |