Reconfigure Visualizations
Thus far, we have added code to the application to handle interactivity which is initiated on the bars or the vector layer. Now we need to add code to handle user interaction that starts trough the pie chart. As discussed in the introduction of section 6, this call for different response. this time we are not going to display more data on the same type that is already presented. No, we will use different data and as such potentially different visualizations. So if the interaction starts in the pie chart, the bars of population will be removed and landuse bars for all districts on the selected landuse class will be drawn. Simultaneously the same landuse values will be shown in the vector layer in the form of a choropleth.
Choropleths
The first step is to catch the events in the pie chart and then associate functions to execute the actions expected as a response to those events. Include the new functions and the event listeners in the CityApp/app/view/statistics/StatisticsController.js file as depicted in Listing 7-1.
|
1 2 3 4 5 6 7 8 9 10 11 12 13 14 15 16 17 18 19 20 21 22 23 24 25 26 27 28 29 30 31 32 33 34 35 36 37 38 39 40 41 42 |
dotdotdot /*- Creates a pie chart based on landuse values -*/ drawPieChart: function(districts, chartPanel){ var pc = new Object; /*---*/ function mouseOverPie(slice){ }; /*---*/ function mouseOutOfPie(){ }; /*---*/ /* Compute statistics per landuse class for the whole municipality */ var groupArea, groupKeys, totalArea; groupKeys = districts[0].data.landuse_2012.map(function(r){ return r.group; }).sort(); dotdotdot /* Pie slices */ pc.obj.selectAll("path") .data(pc.slice(pc.cityTotals)) .enter() .append("path") .attr("id", function(d) { return "pie_" + d.data.group; }) .attr("d", pc.arc) .style("fill-opacity", 0.6) .style("fill", function(r){ return Ext.getStore('colors').getById(r.data.group).get('fill'); }) .style("stroke","#888") .style("stroke-width", 1)MMSSGG003 .on("mouseover", mouseOverPie) .on("mouseout", mouseOutOfPie); /* Labels for the various pie slices */ pc.labelArc = d3.arc() dotdotdot |
Now, let us add some code to the first function, mouseOverPie. we will start by emphasising in the legend the landuse class that the users in interacting with. Then, we will create an array to hold the landuse data for that landuse class in every district (sliceData). For example, the area covered by agriculture in each district, or the area covered by buildings. The necessary code for these actions is shown in Listing 7-2. Update the CityApp/app/view/statistics/StatisticsController.js file accordingly.
|
1 2 3 4 5 6 7 8 9 10 11 12 13 14 15 16 17 18 19 20 21 22 23 24 25 |
dotdotdot /*---*/ function mouseOverPie(slice){ var className, sliceData; d3.selectAll('.legend-element') .style('opacity', function(r){ if (r.class_code == slice.data.group){ className = r.class_name; }; return (r.class_code == slice.data.group) ? 1 : 0.2; }); sliceData = CityApp.app.stsCtrl.districts.map(function(r){ return { code: r.data.code, m2: r.data.landuse_2012.find(function(g){ return ( g.group == slice.data.group); }).m2 } }); console.log(sliceData); }; /*---*/ dotdotdot |
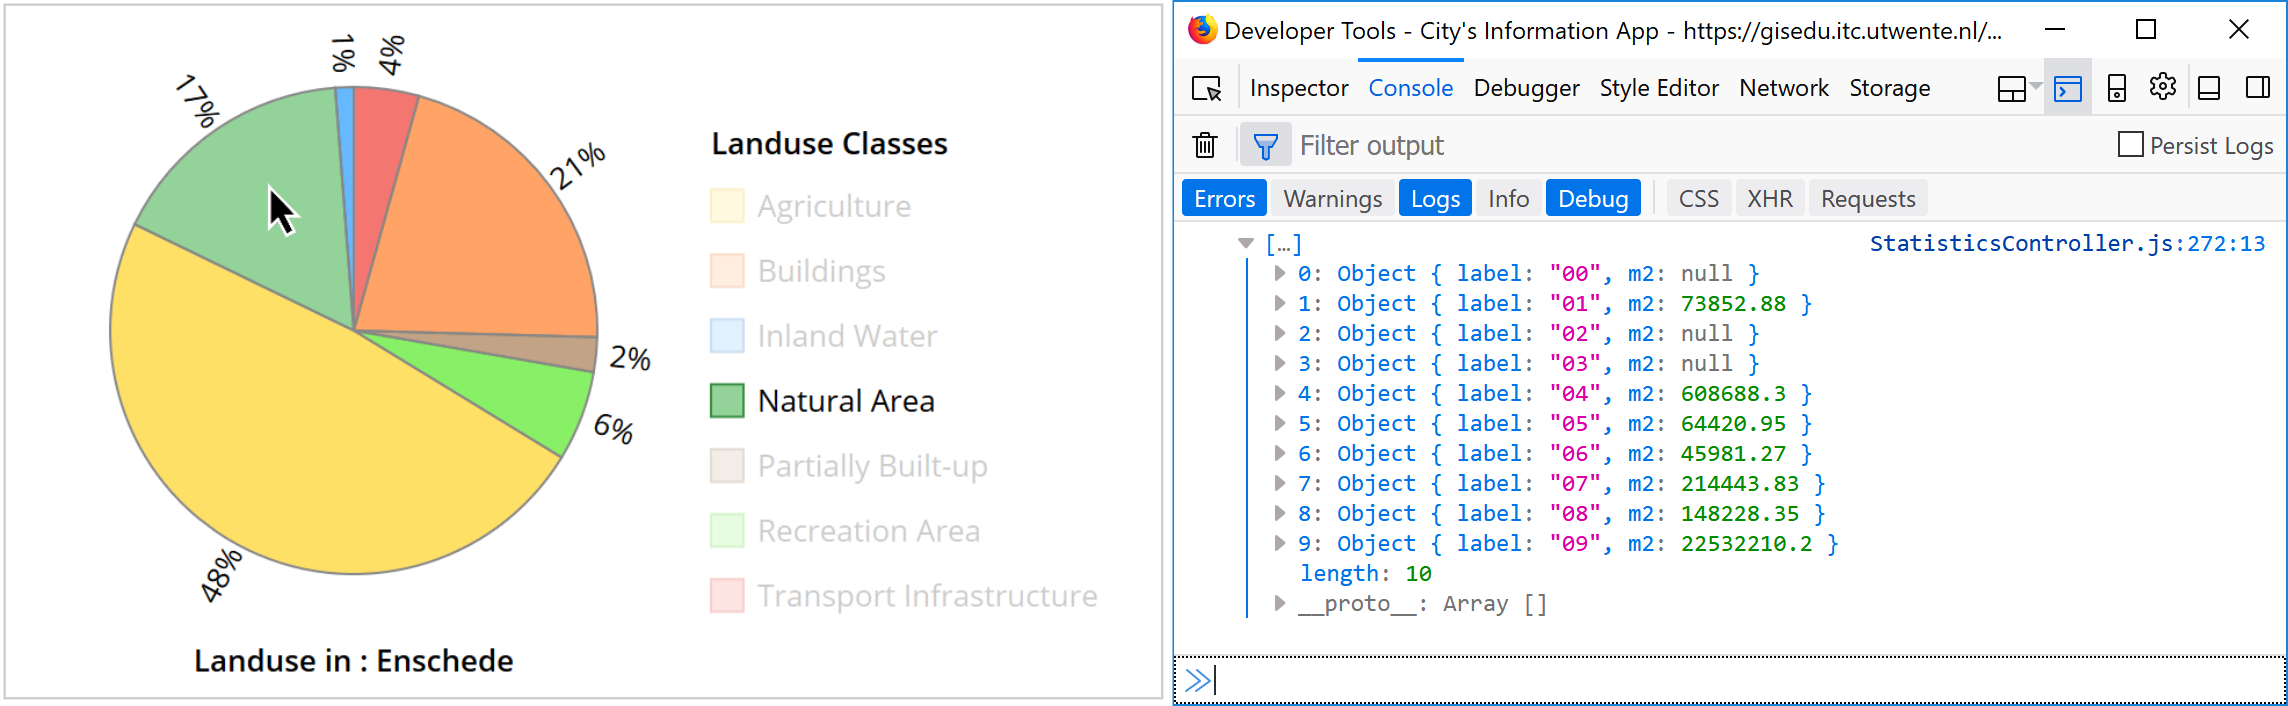
The legend manipulation takes place in lines 7–11, and the generation of the landuse array takes place in lines 13–20. We can refresh the application and check the values in the landuse class array as temporary output in the console 21. Check your console as you move the mouse over the pie chart. Figure 7-1 shows the result for the Natural Area class.
We can now use the content of the sliceData array to create the choropleth of the corresponding landuse class. As always, we will create a function for this, which makes it easier when it comes to code reuse. We can place the function call right after the sliceData array has been populated. Insert the new code from Listing 7-3 in the CityApp/app/view/statistics/StatisticsController.js file.
|
1 2 3 4 5 6 7 8 9 10 11 12 13 14 15 16 17 18 19 20 21 22 23 24 25 26 27 28 29 30 31 32 33 34 35 36 37 |
dotdotdot /*- Displays a choropleth for the provided values of a landuse group -*/ showChoropleth: function(choroData, group, className){ }, /*---*/ /*- Creates a pie chart based on landuse values -*/ drawPieChart: function(districts, chartPanel){ var pc = new Object; /*---*/ function mouseOverPie(slice){ var className, sliceData; d3.selectAll('.legend-element') .style('opacity', function(r){ if (r.class_code == slice.data.group){ className = r.class_name; }; return (r.class_code == slice.data.group) ? 1 : 0.2; }); sliceData = CityApp.app.stsCtrl.districts.map(function(r){ return { label: r.data.label, m2: r.data.landuse_2016.find(function(g){ return ( g.group == slice.data.group); }).m2 } }); CityApp.app.stsCtrl.showChoropleth(sliceData, slice.data.group, className); }; /*---*/ function mouseOutOfPie(){ dotdotdot |
To draw the choropleth, we need to determine how many value levels we want to have. In this case we do not have many districts so four levels will suffice. We also need to create a style that uses the values of the four intensity levels to render vector polygons for each district. For this to work we need to specify the intensity values for each landuse class based on its specific color.
We already have an application object to handle color data. Let us update the Colors store to include intensity values for each class. Use the code in Listing 7-4 to update the CityApp/app/store/Colors.js file.
|
1 2 3 4 5 6 7 8 9 10 11 12 13 14 15 16 17 18 19 20 21 22 23 24 25 26 27 28 29 30 31 32 33 34 35 36 37 38 39 40 41 42 43 44 45 46 47 48 49 50 51 52 53 54 55 56 |
/* Colors store */ Ext.define('CityApp.store.Colors', { extend: 'Ext.data.Store', alias: 'store.colors', storeId: 'colors', model: 'CityApp.model.Color', data : [{ group: 'g1', /*red*/ stroke: '#d41811', fill: '#ec1a13', tints: ['#f9bab8', '#f47671', '#f15854', '#ec1a13'] },{ group: 'g2', /*orange*/ stroke: '#e65c00', fill: '#ff6600', tints: ['#ffc299', '#ffa366', '#ff8533', '#ff6600'] },{ group: 'g3', /*brown*/ stroke: '#734d26', fill: '#996633', tints: ['#e6ccb3', '#d9b38c', '#cc9966', '#bf8040'] },{ group: 'g4', /*light-green*/ stroke: '#33cc00', fill: '#39e600', tints: ['#d9ffcc', '#8cff66', '#53ff1a', '#39e600'] },{ group: 'g5', /*yellow*/ stroke: '#e6b800', fill: '#ffcc00', tints: ['#fff5cc', '#ffeb99', '#ffdb4d', '#ffcc00'] },{ group: 'g6', /*green*/ stroke: '#3c9043', fill: '#4bb454', tints: ['#c9e8cc', '#a5d9a9', '#6fc376', '#4bb454'] },{ group: 'g7', /*blue*/ stroke: '#005fb3', fill: '#0088ff', tints: ['#e6f3ff', '#99cfff', '#4dacff', '#0088ff'] },{ group: 'g8', /*cyan*/ stroke: '#00b3b3', fill: '#00cccc', tints: [ ] },{ group: 'g9', /*purple*/ stroke: '#b034b2', fill: '#c94dcb', tints: [ ] }] }); |
We have added four color values to each landuse class, which we can use in the styling of the choropleths. Include the code of the showChoropleth function in the CityApp/app/view/statistics/StatisticsController.js file as shown in Listing 7-5.
|
1 2 3 4 5 6 7 8 9 10 11 12 13 14 15 16 17 18 19 20 21 22 23 24 25 26 27 28 29 30 31 32 33 34 35 36 37 38 39 40 41 42 43 44 45 46 47 48 49 50 51 52 53 |
dotdotdot /*- Displays a chroropleth for the provided values of a landuse group -*/ showChoropleth: function(choroData, group, className){ var choroClass, colorStore, strokeColor, tintNumber, rgb, fillColor, choroStyle; choroClass = d3.scaleLinear().domain([ d3.min(choroData, function(r){ return r.m2; }), d3.max(choroData, function(r){ return r.m2; }) ]).rangeRound([0, 3]); colorStore = Ext.getStore('colors'); strokeColor = colorStore.getById(group).get('stroke'); choroStyle = function(){ return function(feature, resolution){ tintNumber = choroClass( choroData.find(function(r){ return (r.code == feature.get('district_code')) }).m2 ); rgb = ol.color.asArray(colorStore.getById(group).get('tints')[tintNumber]); fillColor = 'rgba('+ rgb[0] + ', ' + rgb[1] + ', ' + rgb[2] + ', 0.8)'; return new ol.style.Style({ fill: new ol.style.Fill({ color: fillColor }), stroke: new ol.style.Stroke({ color: strokeColor, width: 2 }), text: new ol.style.Text({ textAlign: 'center', textBaseline: 'middle', font: 'Normal 16px Arial', overflow: true, text: feature.get('district_code').substring(6), fill: new ol.style.Fill({color: '#fff'}), stroke: new ol.style.Stroke({color: strokeColor, width: 3}), rotation: 0 }) }); }; }; this.choroLayer.setStyle(choroStyle()); }, /*---*/ /*- Creates a pie chart based on landuse values -*/ drawPieChart: function(districts, chartPanel){ dotdotdot |
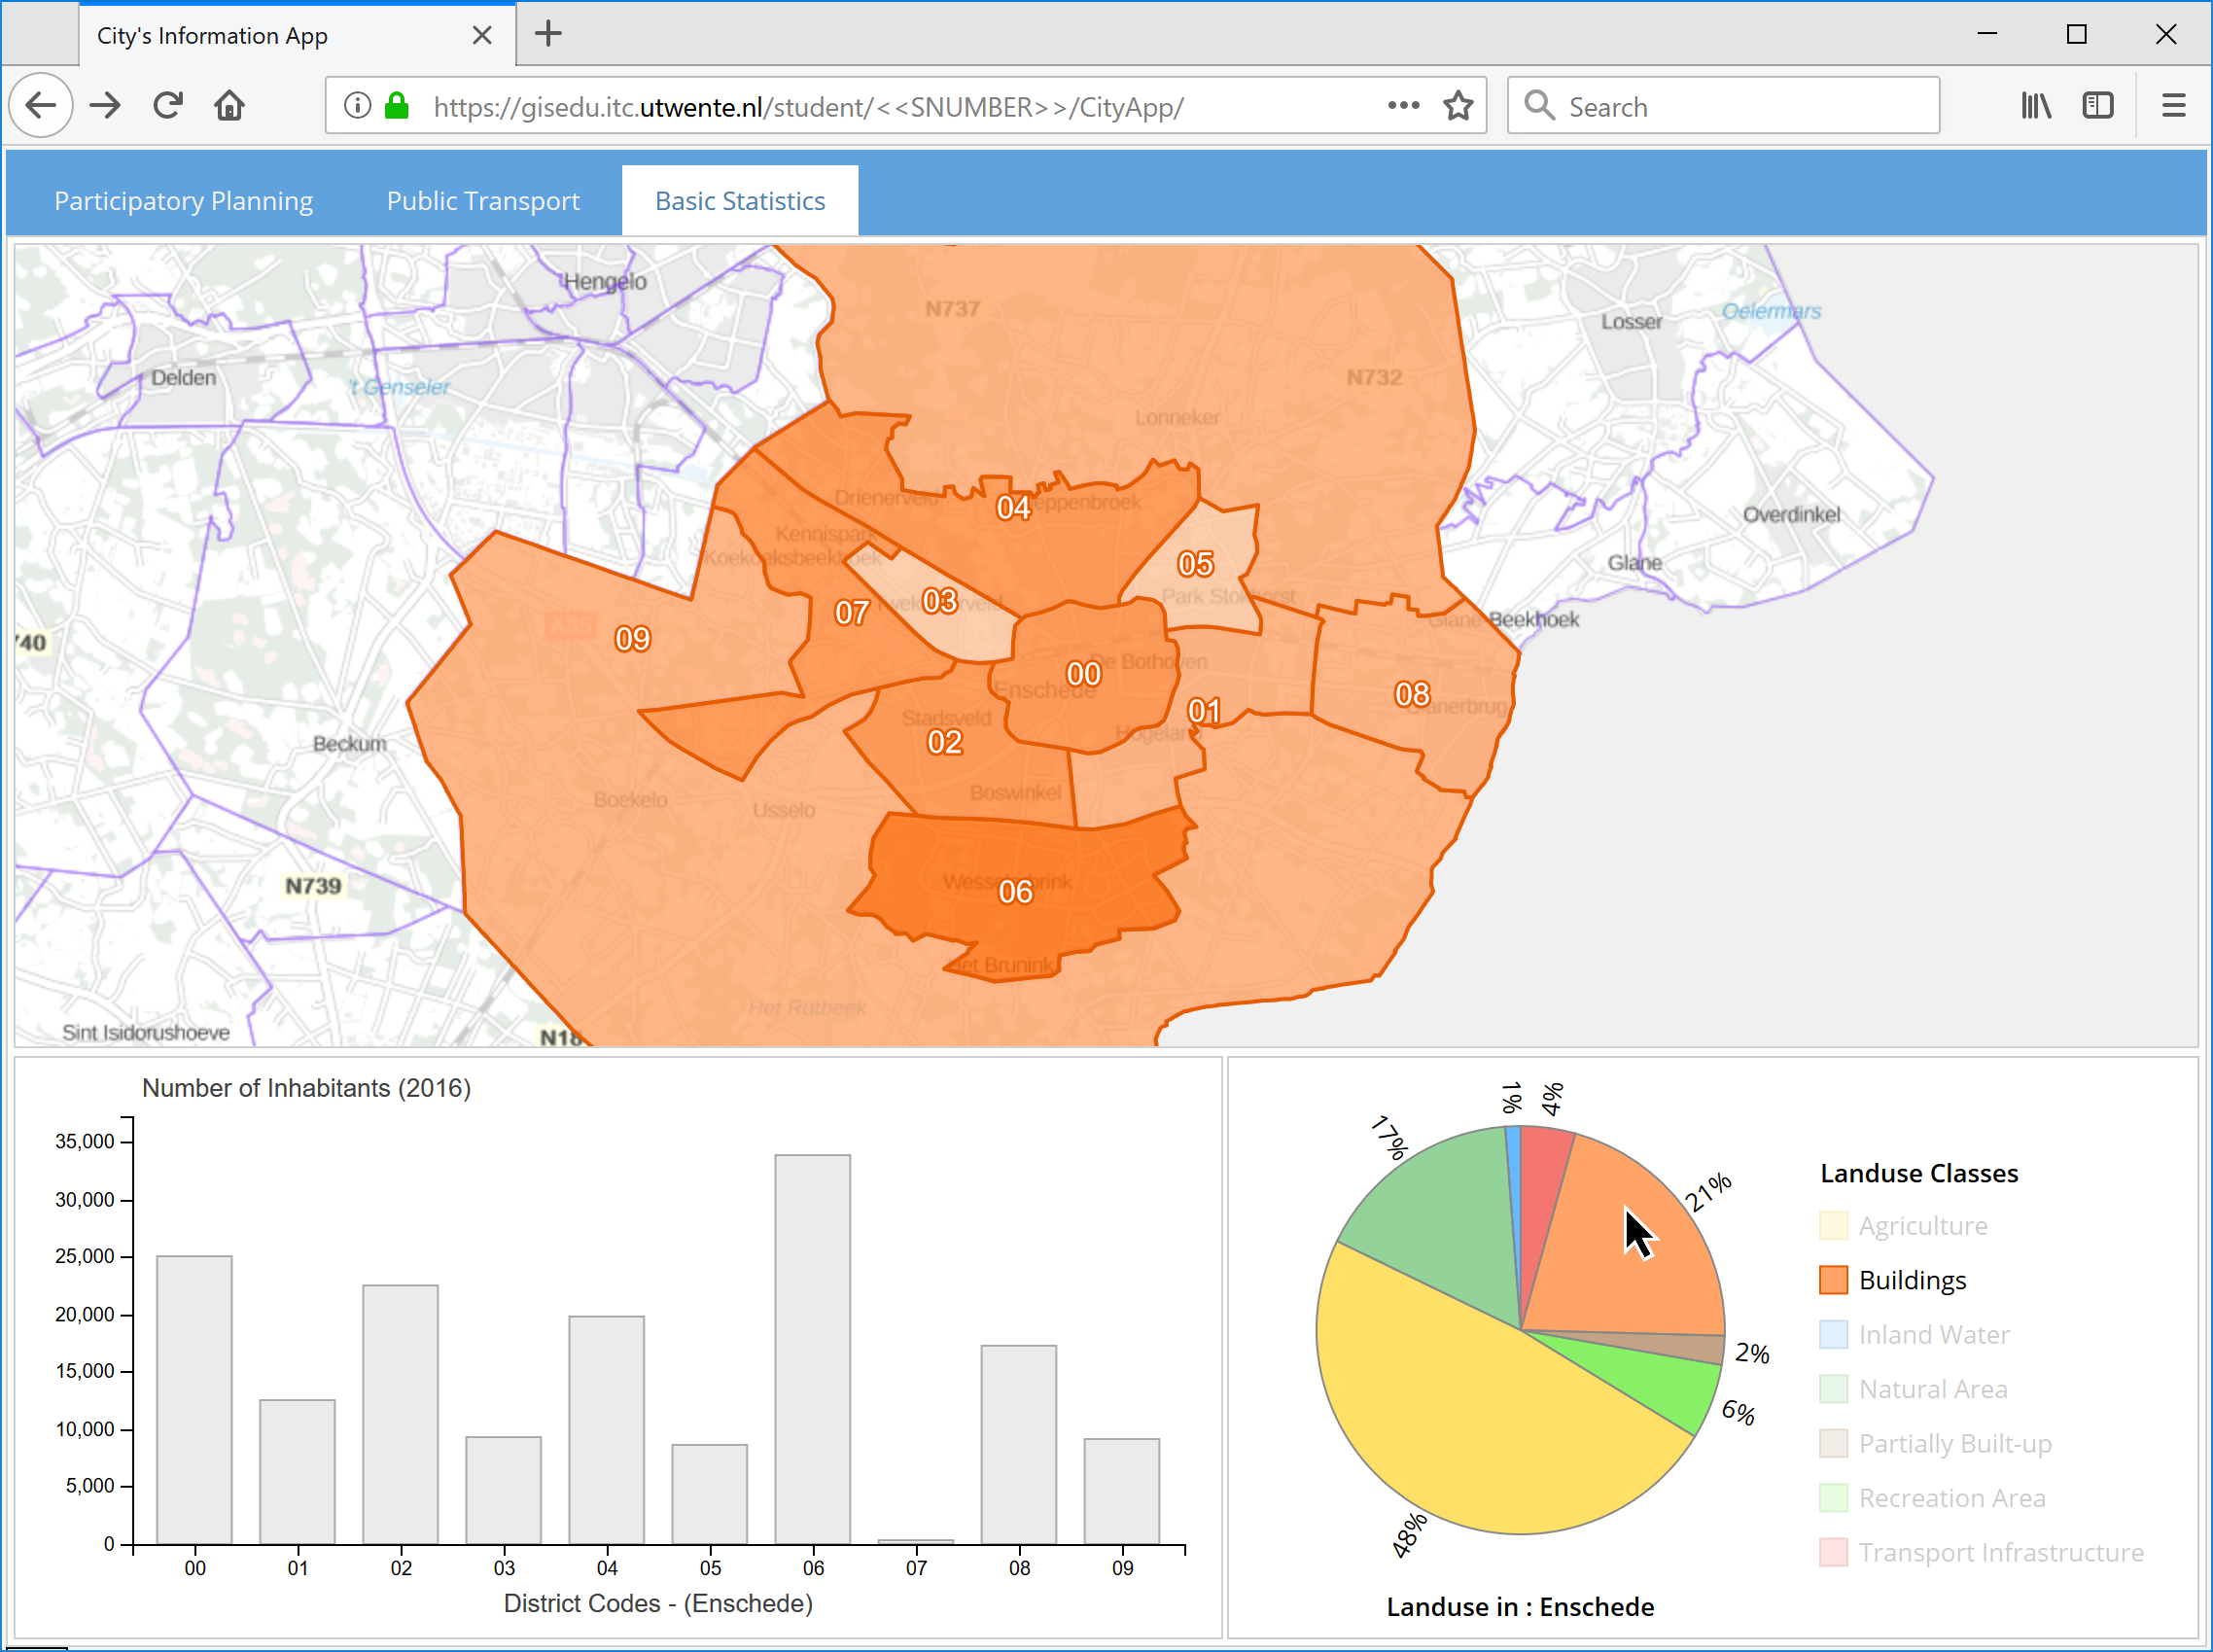
In lines 9–11, we determine the minimum and maximum area value for the landuse class and determine the ranges for the four levels of the choropleth. In lines 15–44, we create a style function which includes the selection of the color of each polygon based on the group id 22–23. Reload the application and move your mouse over the various slices of the pie. Every time you move over a slice, a choropleth for that class should be shown. Figure 7-2 shows the image of one of the resulting choropleths.
We also need to roll the legend and the vector layer back to their normal state once the mouse leaves the pie chart. Make the necessary changes to the CityApp/app/view/statistics/StatisticsController.js as shown in Listing 7-6.
|
1 2 3 4 5 6 7 8 9 10 11 12 13 14 15 16 17 18 19 20 21 22 23 24 25 26 27 28 29 30 31 32 33 34 35 36 37 38 |
dotdotdot drawPieChart: function(districts, chartPanel){ var pc = new Object; /*---*/ function mouseOverPie(slice){ var className, sliceData; d3.selectAll('.legend-element') .style('opacity', function(r){ if (r.class_code == slice.data.group){ className = r.class_name; }; return (r.class_code == slice.data.group) ? 1 : 0.2; }); sliceData = CityApp.app.stsCtrl.districts.map(function(r){ return { code: r.data.code, m2: r.data.landuse_2012.find(function(g){ return (g.group == slice.data.group); }).m2 } }); CityApp.app.stsCtrl.showChoropleth(sliceData, slice.data.group, className); }; /*---*/ function mouseOutOfPie(){ d3.selectAll('.legend-element') .style('opacity', 1); CityApp.app.stsCtrl.choroLayer.setStyle(CityApp.app.stsCtrl.defaultStyle); }; /*---*/ /* Compute statistics per landuse class for the whole municipality */ var groupArea, groupKeys, totalArea; dotdotdot |
Check if the application behaves as expected. If so the default visualization of the vector layer should be in place when the mouse moves out of the pie chart.
Landuse Bars
The next action that we are going to take is to replace the population data with landuse areas in the bar chart. We will also use a function for this task. Similarly, to what we did with the function to show the choropleths, the call to the redrawBars function will be placed in the code that reponds to the mouseover event on the pie chart. Let us add the new function and its corresponding call to the CityApp/app/view/statistics/StatisticsController.js file as shown in Listing 7-7.
|
1 2 3 4 5 6 7 8 9 10 11 12 13 14 15 16 17 18 19 20 21 22 23 24 25 26 27 28 29 30 31 32 33 34 35 36 37 38 39 40 41 42 43 44 45 46 47 48 |
dotdotdot this.choroLayer.setStyle(choroStyle()); }, /*---*/ /*- Draws new bars based on a given set of values -*/ redrawBars: function(barsData, fillColor, strokeColor, yAxisLabel){ }, /*---*/ /*- Creates a pie chart based on landuse values -*/ drawPieChart: function(districts, chartPanel){ var pc = new Object; /*---*/ function mouseOverPie(slice){ var className, sliceData; d3.selectAll('.legend-element') .style('opacity', function(r){ if (r.class_code == slice.data.group){ className = r.class_name; }; return (r.class_code == slice.data.group) ? 1 : 0.2; }); sliceData = CityApp.app.stsCtrl.districts.map(function(r){ return { code: r.data.code, m2: r.data.landuse_2016.find(function(g){ return (g.group == slice.data.group); }).m2 } }); CityApp.app.stsCtrl.showChoropleth(sliceData, slice.data.group, className); CityApp.app.stsCtrl.redrawBars( sliceData, Ext.getStore('colors').getById(slice.data.group).get('fill'), Ext.getStore('colors').getById(slice.data.group).get('stroke'), 'Area covered by (' + className + ') in Hectares' ); }; /*---*/ function mouseOutOfPie(){ dotdotdot |
For the generation of the bars, we will use the same data as for the choropleths, which is stored in the sliceData array. The redrawBars function requires various parameters. The data for the bars, the bars line color and fill color, and, the title for the y axis. The y axis will depict areas in square kilometers, while the x axis remains unchanged. Include the code for the redrawBars function in the CityApp/app/view/statistics/StatisticsController.js file (see Listing 7-8).
|
1 2 3 4 5 6 7 8 9 10 11 12 13 14 15 16 17 18 19 20 21 22 23 24 25 26 27 28 29 30 31 32 33 34 35 36 37 38 39 40 |
dotdotdot this.choroLayer.setStyle(choroStyle()); }, /*---*/ /*- Draws new bars based on a given set of values -*/ redrawBars: function(barsData, fillColor, strokeColor, yAxisLabel){ var bc = this.barChart; bc.y.domain([0, d3.max(barsData, function(r){ return r.m2/10000; })]); bc.obj.selectAll(".bar") .data(barsData) .transition().duration(200) .attr("y", function(r){ return bc.y(r.m2/10000); }) .attr("height", function(r){ return bc.height - bc.y(r.m2/10000); }) .style("stroke", strokeColor) .style("fill", fillColor); bc.obj.selectAll(".y.axis") .call(d3.axisLeft(bc.y)); d3.select('#bc_yaxis_label') .text(yAxisLabel); }, /*---*/ /*- Creates a pie chart based on landuse values -*/ drawPieChart: function(districts, chartPanel){ dotdotdot |
Go ahead and reload the application to test the new function. The bar chart should also now respond to the user's interaction with the pie slices. Check if the label of the y axis also responds correctly.
Just as before we are only half way through here. We certainly want to return the bars to their original state when the mouse goes out of the pie chart, so that we keep the interface consistent. This time the rollback operation is a little bit more challenging because the datasets are different. Let us start by triggering redrawBars function when the mouse leaves the pie. The necessary code for this is shown in Listing 7-9. Include the new code in the CityApp/app/view/statistics/StatisticsController.js file.
|
1 2 3 4 5 6 7 8 9 10 11 12 13 14 15 16 17 18 19 20 21 22 23 24 |
dotdotdot CityApp.app.stsCtrl.redrawBars( sliceData, Ext.getStore('colors').getById(slice.data.group).get('fill'), Ext.getStore('colors').getById(slice.data.group).get('stroke'), 'Area covered by (' + className + ') in Hectares' ); }; /*---*/ function mouseOutOfPie(){ d3.selectAll('.legend-element') .style('opacity', 1); CityApp.app.stsCtrl.choroLayer.setStyle(CityApp.app.stsCtrl.defaultStyle); CityApp.app.stsCtrl.redrawBars( CityApp.app.stsCtrl.districts, '#CACCCE', '#AAA', 'Number of Inhabitants (2016)' ); }; /*---*/ dotdotdot |
If you reload the application at this point, you will notice that there are no bars shown as the mouse leaves the pie chart. This is because the function to redraw the bars does not know what attribute from the new dataset (districts) to use for the bars. Right now, the function tries to draw bars using the m2 attribute, which is not avsilable in the root of the districts dataset. Let us repair that. We will use a boolean variable to keep track of whether the bars should be drawn from population data or from landuse data. Update the CityApp/app/view/statistics/StatisticsController.js file according to Listing 7-10.
|
1 2 3 4 5 6 7 8 9 10 11 12 13 14 15 |
dotdotdot /*- Draws a bar chart after the data of the districts has been received -*/ drawBarChart: function(districts, chartPanel){ var bc = new Object; bc.popBars = true; /* Boolean to control the type of data for the bars (pop/landuse) */ var barTooltip = d3.select("body") .append("div") .attr("id", "bar-tooltip") .attr("class", "tooltip"); /*---*/ function onMouseOverChart(record){ dotdotdot |
Now, we will say that when the value of the popBars is true then the population data should be used to draw the bars. On the contrary when the vale is false the bars should be drawn using landuse data. With this level of control available, we can include the corresponding conditionals in the redrawBars function to generate the correct bars every time. The code for the conditionals is shown in Listing 7-11. Use it to update the CityApp/app/view/statistics/StatisticsController.js file.
|
1 2 3 4 5 6 7 8 9 10 11 12 13 14 15 16 17 18 19 20 21 22 23 24 25 26 27 28 29 30 31 32 33 34 35 36 37 38 39 |
dotdotdot this.choroLayer.setStyle(choroStyle()); }, /*---*/ /*- Draws new bars based on a given set of values -*/ redrawBars: function(barsData, fillColor, strokeColor, yAxisLabel){ var bc = this.barChart; bc.y.domain([0, d3.max(barsData, function(r){ return (bc.popBars) ? r.data.pop_2016 : r.m2/10000; })]); bc.obj.selectAll(".bar") .data(barsData) .transition().duration(200) .attr("y", function(r){ return bc.y((bc.popBars) ? r.data.pop_2016 : r.m2/10000); }) .attr("height", function(r){ return bc.height - bc.y((bc.popBars) ? r.data.pop_2016 : r.m2/10000); }) .style("stroke", strokeColor) .style("fill", fillColor); bc.obj.selectAll(".y.axis") .call(d3.axisLeft(bc.y)); d3.select('#bc_yaxis_label') .text(yAxisLabel); }, /*---*/ /*- Creates a pie chart based on landuse values -*/ drawPieChart: function(districts, chartPanel){ dotdotdot |
We have included a conditional in teh generation of the domains and the size of the bars 12, 19, 22. We also need to make sure that the value of the popBars variable is assigned properly before the redrawBars function is called. Otherwise we will still have the wrong behaviour. Set the values for the popBars in the CityApp/app/view/statistics/StatisticsController.js file as shown in Listing 7-12.
|
1 2 3 4 5 6 7 8 9 10 11 12 13 14 15 16 17 18 19 20 21 22 23 24 25 26 27 28 29 30 31 32 33 34 35 36 37 38 39 40 41 42 43 |
dotdotdot /*---*/ function mouseOverPie(slice){ var className, sliceData; d3.selectAll('.legend-element') .style('opacity', function(r){ if (r.class_code == slice.data.group){ className = r.class_name; }; return (r.class_code == slice.data.group) ? 1 : 0.2; }); sliceData = CityApp.app.stsCtrl.districts.map(function(r){ return { code: r.data.code, m2: r.data.landuse_2016.find(function(g){ return (g.group == slice.data.group); }).m2 } }); CityApp.app.stsCtrl.showChoropleth(sliceData, slice.data.group, className); CityApp.app.stsCtrl.barChart.popBars = false; CityApp.app.stsCtrl.redrawBars( sliceData, Ext.getStore('colors').getById(slice.data.group).get('fill'), Ext.getStore('colors').getById(slice.data.group).get('stroke'), 'Area covered by (' + className + ') in Hectares' ); }; /*---*/ function mouseOutOfPie(){ d3.selectAll('.legend-element') .style('opacity', 1); CityApp.app.stsCtrl.choroLayer.setStyle(CityApp.app.stsCtrl.defaultStyle); CityApp.app.stsCtrl.barChart.popBars = true; CityApp.app.stsCtrl.redrawBars( CityApp.app.stsCtrl.districts, '#CACCCE', '#AAA', 'Number of Inhabitants (2016)' ); dotdotdot |
These changes complete the task of redrawing the bar chart. Reload the application and check that indeed the bars return to their default state as the interaction with the pie chart finishes.
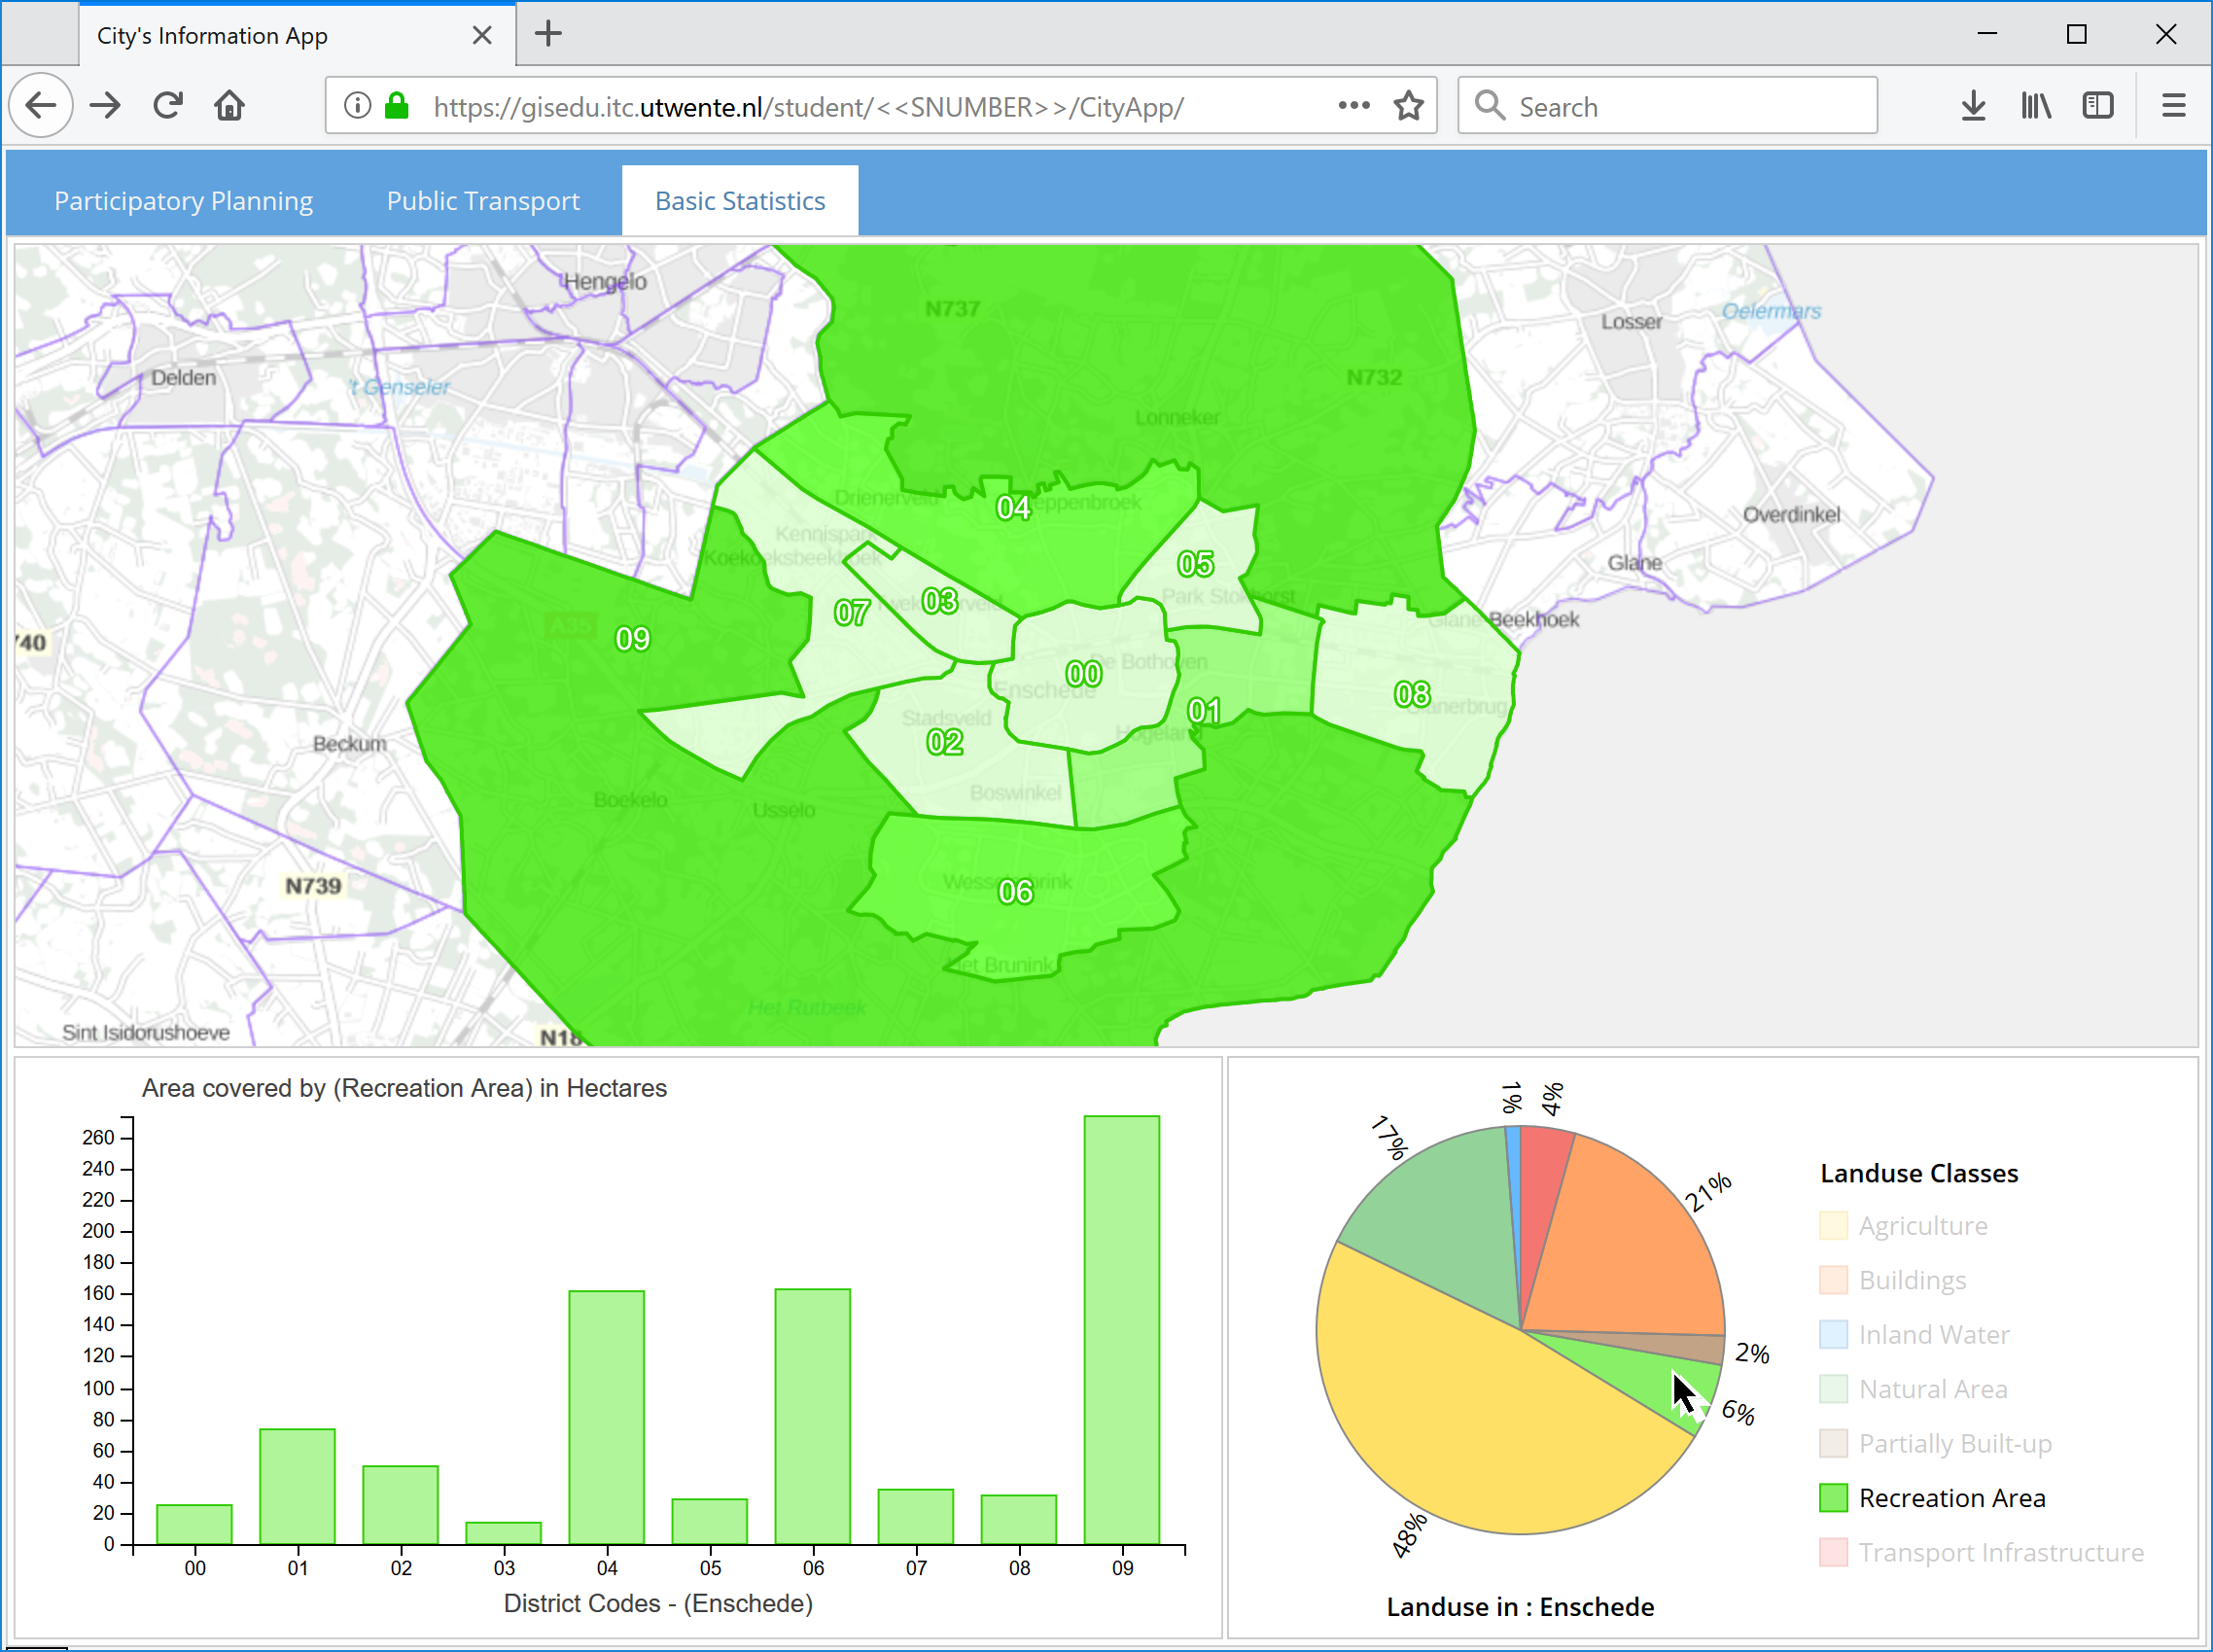
Figure 7-3 depicts the look and feel of the application after the code to redraw tha bars has been included.
Floating Legends
When the choropleths are displayed, the user needs a reference as to the meaning of the colors. Yes, there are only four classes but still, we need to tell the user the ranges of the classes. This means we need a legend for the choropleth. The key question now is where to place it. The first thing is, it should not be permanent like the landuse classes legend, because it only makes sense to see it when the corresponding data is visible. Second, the content of the legend also changes as the users move between the various slices. And, last we do not have a container where to render it. Since the content of the legend is dynamic and non-permanent, we can choose for a popup, or better a window for the legend. Let us go for a window. Create theCityApp/app/view/statistics/LegendWindow.js file using the code in Listing 7-13.
|
1 2 3 4 5 6 7 8 9 10 11 12 13 14 15 16 17 18 |
/*--- Legend window ---*/ "use strict"; Ext.define('CityApp.view.statistics.LegendWindow', { extend: 'Ext.window.Window', alias: 'widget.legendwindow', layout: 'fit', padding: 12, border: false, header: false, closable: false, resizable: false, style: { border: 'solid 1px #cccccc' } }); |
The code for the window definition is self-explanatory. Note that we have omitted any size or position attributes. We will specify that dynamically depending on what do we use this window for. Now, attach the window to the application by updating the CityApp/app/view/statistics/StatisticsController.js file as shown in Listing 7-14.
|
1 2 3 4 5 6 7 8 9 10 11 12 13 14 15 16 17 18 19 20 21 22 23 24 25 26 27 28 29 30 31 32 33 34 35 |
dotdotdot Ext.define('CityApp.view.statistics.StatisticsController', { extend: 'Ext.app.ViewController', alias: 'controller.statistics-main', requires: [ 'CityApp.view.statistics.LegendWindow' ], stsMap: null, districts: null, dotdotdot /*- Performs initialization actions after the view has been rendered by the browser -*/ initializeView: function(){ Ext.create({ xtype: 'legendwindow', id: 'choro_legend_window', height: 85, width: 128, listeners: { 'show': function() { this.setX(Ext.getCmp('sts_map_panel').getX() + 5); this.setY(Ext.getCmp('sts_map_panel').getHeight() - this.getHeight()+45); } } }); this.stsMap = CityApp.app.homeCtrl.createMap('brtachtergrondkaartgrijs', 'sts_map_panel'); this.stsMap.getView().setCenter(CityApp.app.cityCoords); this.stsMap.getView().setZoom(7); dotdotdot |
Inside our initialization function of the view, we have created a ne window object 17–28 using the window type specified earlier 18. We have specified the window size 20–21. And, we have added a listener to the window to catch the show event 23–27, which is fired when the window becomes visible. We use the event to position the legend window relative (bottom-left) to the coordinates of the map panel 24–25.
The next step is to generate the content of the choropleth legend. The legend will be different for every landuse class therefore we have to generate new content for the legend every time the choropleth changes. The corresponding code should be included in the CityApp/app/view/statistics/StatisticsController.js file as shown in Listing 7-15.
|
1 2 3 4 5 6 7 8 9 10 11 12 13 14 15 16 17 18 19 20 21 22 23 24 25 26 27 28 29 30 31 32 33 34 35 36 37 38 39 40 41 42 43 44 45 46 47 48 49 50 |
dotdotdot /*- Displays a chroropleth for the provided values of a landuse group -*/ showChoropleth: function(choroData, group, className){ var choroClass, colorStore, strokeColor, tintNumber, rgb, fillColor, choroStyle, choroLegendWindow, limits, choroLegendObj; choroClass = d3.scaleLinear().domain([ d3.min(choroData, function(r){ return r.m2; }), d3.max(choroData, function(r){ return r.m2; }) ]).rangeRound([0, 3]); colorStore = Ext.getStore('colors'); strokeColor = colorStore.getById(group).get('stroke'); /* create the content for the legend based of the tints of the selected group */ choroLegendWindow = Ext.getCmp('choro_legend_window'); choroLegendWindow.show(); limits = [ Math.round(choroClass.domain()[0]/10000), Math.round(choroClass.domain()[1]/10000) ]; choroLegendWindow.setHtml( '<div><span style="line-height: 1.6;"><b>Hectares in 2016</b><br/>' + limits[0] + '<span style="float:right;">' + limits[1] + ' </span></span></div>' ); choroLegendObj = d3.select("#" + choroLegendWindow.body.id).append("svg") .attr("width", 160) .attr("height", 12); for (var i = 0; i <= 3; i++) { choroLegendObj.append("rect") .attr("x", i*25) .attr("height", 12) .attr("width", 25) .attr("fill", colorStore.getById(group).get('tints')[i]); }; choroStyle = function(){ return function(feature, resolution){ tintNumber = choroClass( choroData.find(function(r){ return (r.code == feature.get('district_code')) }).m2 ); dotdotdot |
Here, we start by making the legend window visible 16–17. Then, we determine the minimum and maximum values (limits) for each class in hectares 20–21. Next, we add to the window a title for the legend and the values of the limits that we just computed 22–28. After that we create an SVG object for the legend 30–32. And finally, we draw rectangles for the four intensity levels of each landuse class 34–40. Reload the application once more to check the legends of the choropleths. The legend should dynamically adjust to the values of every landuse class in the pie.
Now the legend shows up nicely when the mouse goes over the pie chart, but it does not disappear when the mouse goes out. Hmm, have we not seen this before? Yes we have. Let us add code to hide the window as part of the mouseout event on the pie. Add the new code shown in Listing 7-16 to the CityApp/app/view/statistics/StatisticsController.js file.
|
1 2 3 4 5 6 7 8 9 10 11 12 13 14 15 16 17 18 19 |
dotdotdot /*---*/ function mouseOutOfPie(){ d3.selectAll('.legend-element') .style('opacity', 1); CityApp.app.stsCtrl.choroLayer.setStyle(CityApp.app.stsCtrl.defaultStyle); CityApp.app.stsCtrl.barChart.popBars = true; CityApp.app.stsCtrl.redrawBars( CityApp.app.stsCtrl.districts, '#CACCCE', '#AAA', 'Number of Inhabitants (2016)' ); Ext.getCmp('choro_legend_window').hide(); }; /*---*/ dotdotdot |
Are we done? Perhaps we are. Let us ask ourselves a question. Can we tell which district has the largest area covered by buildings. If you place your mouse over the slice for 'Buildings' in the pie, you will come with an answer. You will say district 06. Then I will say, OK, but which district is district 06. Then you will certainly be able to find out, but not while interacting with the pie chart. So, I would say we are not done yet. We also need to display the names of the districts as part of this interaction path. But where to put them? Well, we have various choices, but since we already created a window object, we can certainly reuse it again and pally the same trick as with the choropleth legend. Let us get at it. Create a new legend window by adding the code in Listing 7-17 to the CityApp/app/view/statistics/StatisticsController.js file.
|
1 2 3 4 5 6 7 8 9 10 11 12 13 14 15 16 17 18 19 20 21 22 |
dotdotdot /*- Performs initialization actions after the view has been rendered by the browser -*/ initializeView: function(){ Ext.create({ xtype: 'legendwindow', id: 'districts_legend_window', height: 220, width: 240, listeners: { 'show': function() { this.setX(Ext.getCmp('sts_map_panel').getWidth() - this.getWidth()); this.setY(Ext.getCmp('sts_map_panel').getHeight() - this.getHeight()+45); } } }); Ext.create({ xtype: 'legendwindow', id: 'choro_legend_window', dotdotdot |
Similar approach as before, but this time we are placing the window on the bottom-right of the map panel 16–17. Let us now create the content. This is content is not dynamic the names will always be the same, so we can create this content when we receive the response to the districtstats service. Update the CityApp/app/view/statistics/StatisticsController.js as shown in Listing 7-18.
|
1 2 3 4 5 6 7 8 9 10 11 12 13 14 15 16 17 18 19 20 21 22 23 24 25 26 27 28 29 30 31 32 33 34 35 36 37 38 39 |
dotdotdot var districtsWMS = new ol.layer.Image({ source: new ol.source.ImageWMS({ url: 'https://gisedu.itc.utwente.nl/cgi-bin/mapserv.exe?', params: { 'MAP': 'd:/iishome/student/SSNUMBERR/CityApp/app/api/adminboundaries.map', 'LAYERS': 'districts', 'SERVER': 'MapServer', 'TILED': true } }), name: 'District Boundaries', visible: true }); this.stsMap.addLayer(districtsWMS); this.renderVectorFeatures(); var stsCtrl = this; Ext.getStore('districts').load({ params: { 'cityname': homeCtrl.cityName }, callback: function(records){ var html = '<span style="line-height:1.8;"><b>District Names</b></span><br/>' records.forEach(function(record){ html += '<b>' + record.data.label + ':</b> ' + record.data.name + '<br/>' }); Ext.getCmp('districts_legend_window').setHtml(html); stsCtrl.districts = records; stsCtrl.barChart = stsCtrl.drawBarChart(stsCtrl.districts, 'sts_barchart_panel'); stsCtrl.drawPieLegend('sts_pielegend_panel'); stsCtrl.pieChart = stsCtrl.drawPieChart(stsCtrl.districts, 'sts_piechart_panel'); }, scope: this }); dotdotdot |
Now we only need to show or hide this window at the appropriate moments. Check Listing 7-19 and add the new code to the CityApp/app/view/statistics/StatisticsController.js file.
|
1 2 3 4 5 6 7 8 9 10 11 12 13 14 15 16 17 18 19 20 21 22 23 24 25 26 27 28 29 30 31 32 33 34 35 36 37 38 39 40 41 42 43 44 45 46 47 48 49 |
dotdotdot /*---*/ function mouseOverPie(slice){ var className, sliceData; d3.selectAll('.legend-element') .style('opacity', function(r){ if (r.class_code == slice.data.group){ className = r.class_name; }; return (r.class_code == slice.data.group) ? 1 : 0.2; }); sliceData = CityApp.app.stsCtrl.districts.map(function(r){ return { code: r.data.code, m2: r.data.landuse_2012.find(function(g){ return (g.group == slice.data.group); }).m2 } }); Ext.getCmp('districts_legend_window').show(); CityApp.app.stsCtrl.showChoropleth(sliceData, slice.data.group, className); CityApp.app.stsCtrl.barChart.popBars = false; CityApp.app.stsCtrl.redrawBars( sliceData, Ext.getStore('colors').getById(slice.data.group).get('fill'), Ext.getStore('colors').getById(slice.data.group).get('stroke'), 'Area covered by (' + className + ') in Hectares' ); }; /*---*/ function mouseOutOfPie(){ d3.selectAll('.legend-element') .style('opacity', 1); CityApp.app.stsCtrl.choroLayer.setStyle(CityApp.app.stsCtrl.defaultStyle); CityApp.app.stsCtrl.barChart.popBars = true; CityApp.app.stsCtrl.redrawBars( CityApp.app.stsCtrl.districts, '#CACCCE', '#AAA', 'Number of Inhabitants (2016)' ); Ext.getCmp('districts_legend_window').hide(); Ext.getCmp('choro_legend_window').hide(); }; /*---*/ dotdotdot |
External Events
Throughout this exercise, we have created application objects, identified relevant events on these objects, and create the expected response to the occurrence of the events. There are however other events that might interfere with the correct behaviour of the application but that are not triggered of our application objects. Try resizing the browser for example. If you do so you will notice that not all the objects of our application respond accordingly. The map gets distorted and the bar chart does not react at all. We need to make sure that these external event does not impact the application negatively.
Fixing the behaviour of the map is easy because OpenLayers provides a function to handle this situation. We only need to call the function when ever the resize event occurs. So, what we need to do is registered the resize of the map panel with the controller and then assign an application function to take the necessary actions. Update the CityApp/app/view/statistics/StatisticsController.js file as shown in Listing 7-20.
|
1 2 3 4 5 6 7 8 9 10 11 12 13 14 15 16 17 18 19 20 21 22 23 24 25 26 27 28 29 30 31 32 33 34 35 36 37 38 39 |
dotdotdot userEvent: true, init: function() { CityApp.app.stsCtrl = this; this.control({ 'statisticsview': { 'boxready': 'initializeView' },MMSSGG001 'panel#sts_map_panel': { 'resize': 'onMapPanelResize' } }); }, /*---*/ dotdotdot Ext.getCmp('sts_map_panel').getEl().on('mouseleave',function(){ stsCtrl.onMouseOverFeature.getFeatures().clear(); }); }, /*---*/ /*- Refreshes the map when its containing panel is resized -*/ onMapPanelResize: function(){ if (this.stsMap){ this.stsMap.updateSize(); }; }, /*---*/ /*- Overlays on the base map a vector layer with the districts -*/ renderVectorFeatures: function(){ var featuresUrl = 'https://gisedu.itc.utwente.nl/cgi-bin/mapserv.exe?' + dotdotdot |
Reload and try again, this time the map should respond correctly to any resize action on the browser window.
In the case of the bar chart what we need to do is to recompute the size of the bars and axes based on the new size of the panel that contains the chart. We will create a function for that and will associate it to the resize event of the container of the bar chart. Check Listing 7-21 for the corresponding code, which should be included in the CityApp/app/view/statistics/StatisticsController.js file.
|
1 2 3 4 5 6 7 8 9 10 11 12 13 14 15 16 17 18 19 20 21 22 23 24 25 26 27 28 29 30 31 32 33 34 35 36 37 38 39 40 41 42 43 44 45 46 47 48 49 50 51 52 53 54 55 56 57 58 59 60 |
dotdotdot userEvent: true, init: function() { stsCtrl = this; this.control({ 'statisticsview': { 'boxready': 'initializeView' }, 'panel#sts_barchart_panel': { 'resize': 'resizeBarChart' }, 'panel#sts_map_panel': { 'resize': 'onMapPanelResize' } }); }, /*---*/ dotdotdot d3.select('#pie_title') .text('Landuse in : ' + districtName); }, /*---*/ /*- Redraws the bar chart when its container panel is resized -*/ resizeBarChart: function(){ if (this.barChart){ var bc = this.barChart; bc.width = bc.panel.getWidth() - bc.margin.left - bc.margin.right - 1; bc.height = bc.panel.getHeight() - bc.margin.top - bc.margin.bottom; d3.select('svg#bar_chart') .attr("width", bc.panel.getWidth()); bc.x.range([0, bc.width]).padding(0.1); bc.obj.selectAll(".x.axis") .attr("transform", "translate(0," + bc.height + ")") .call(d3.axisBottom(bc.x)) .select('#bc_xaxis_label') .attr("x", bc.width/2); bc.obj.selectAll(".bar") .attr("x", function(r) { return bc.x(r.data.label); }) .attr("width", bc.x.bandwidth()*.8); } }, /*---*/ /*- Draws a bar chart after one the data of the districts has been received -*/ drawBarChart: function(districts, chartPanel){ var bc = new Object; dotdotdot |